. 2004 Aug;18(11):1303-5.
doi: 10.1096/fj.03-1001fje. Epub 2004 Jun 4.

Cytokine stimulation of aerobic glycolysis in hematopoietic cells exceeds proliferative demand

Affiliations

Cytokine stimulation of aerobic glycolysis in hematopoietic cells exceeds proliferative demand

Daniel E Bauer et al. FASEB J. 2004 Aug.

Abstract

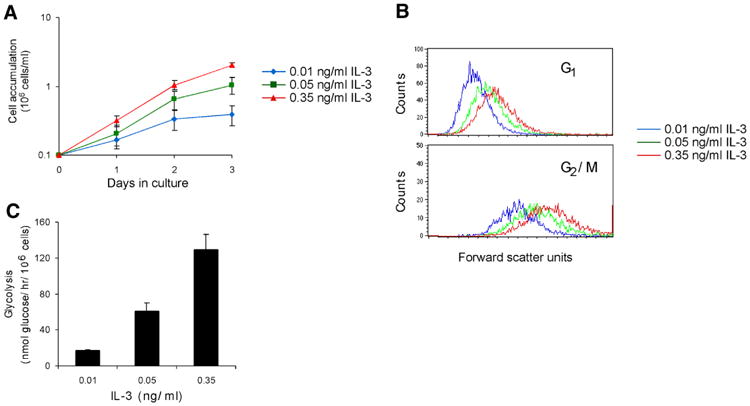
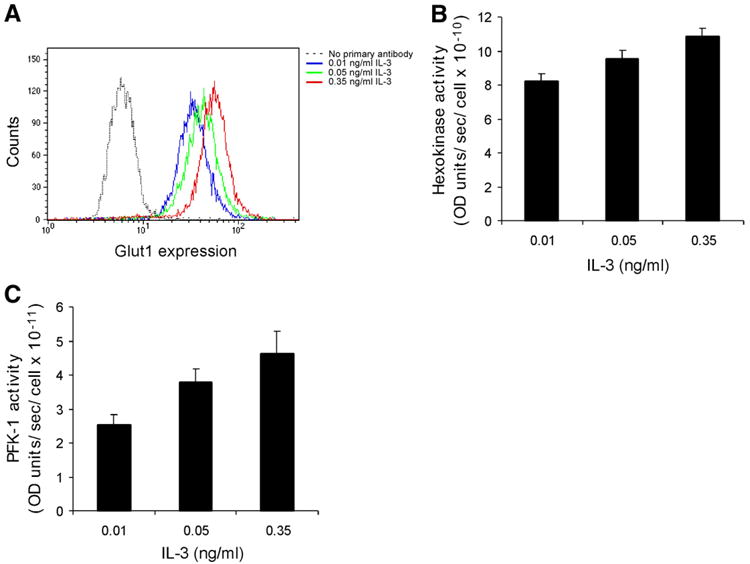
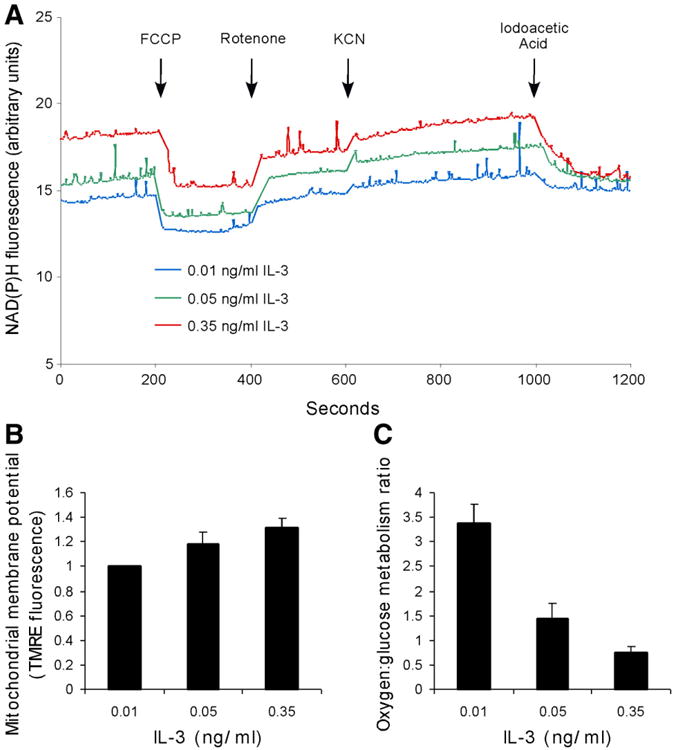
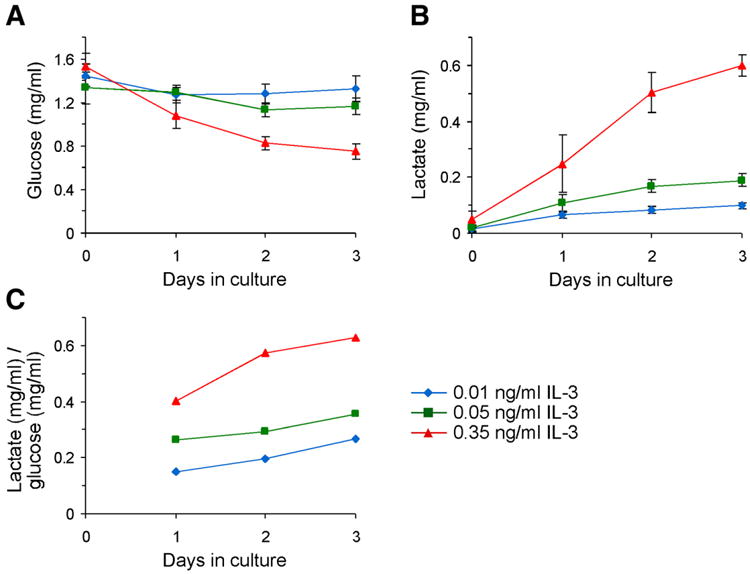
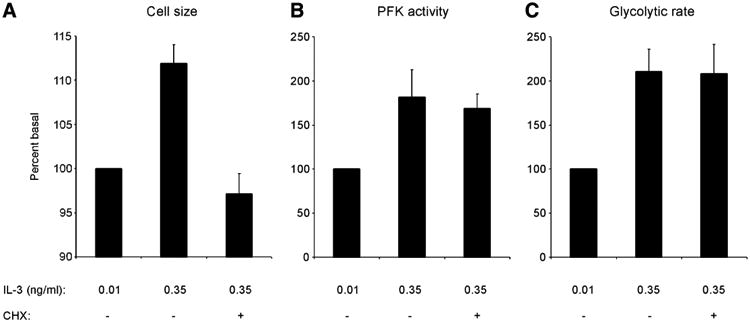
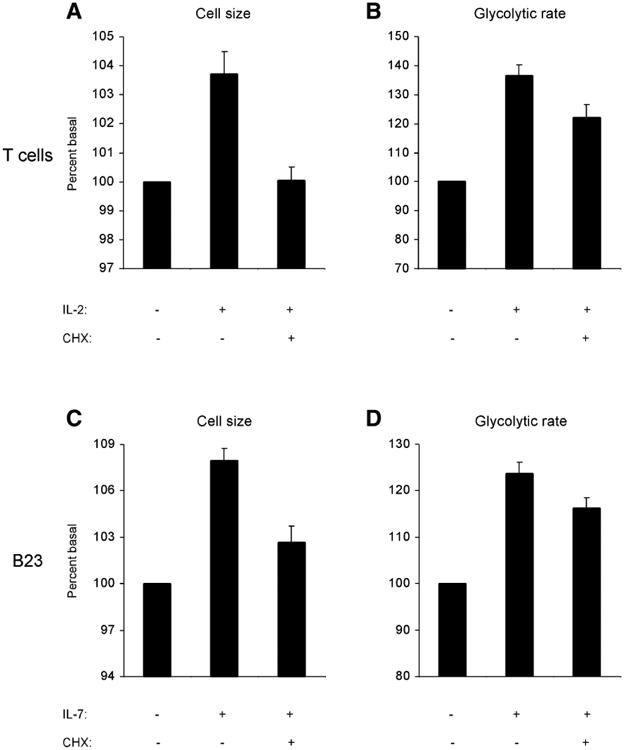
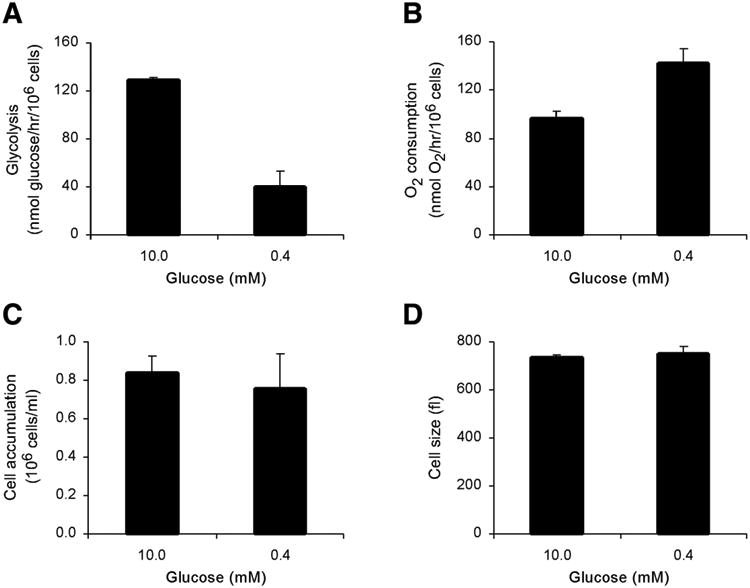
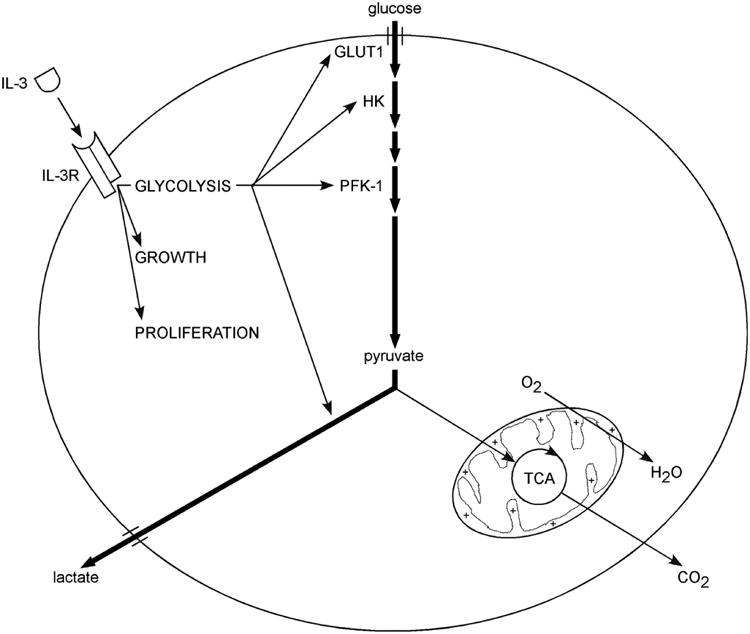
The relationship between growth factor-dependent cell growth and proliferation and the up-regulation of cellular metabolism required to support these processes remains poorly defined. Here, we demonstrate that cell growth, proliferation, and glucose metabolism are coordinately regulated by interleukin-3 (IL-3) in cytokine-dependent cells. Surprisingly, glycolytic activity is stimulated to a greater extent than would be expected based on the rate of cell growth or proliferation. IL-3 signaling exerts a direct effect on glycolytic commitment independent of cell growth control. These results are not restricted to IL-3 as the cytokines IL-7 and IL-2 have similar effects on glucose metabolism when assayed in factor-dependent cell lines or primary lymphocytes, respectively. Growth factor stimulation leads cells to consume less oxygen and produce more lactate per glucose, indicative of conversion from oxidative to glycolytic metabolism. The enforced rate of glucose metabolism is in excess of that required to support cell growth; accordingly, if extracellular glucose is reduced, cells retain the ability to grow and proliferate by derepressing oxidative metabolism. These data suggest that the high rate of glycolysis observed in response to growth factor stimulation is a primary effect rather than a homeostatic response to increased cell growth.


Figures

Figure 1
Figure 1. IL-3 stimulation results in increases in cell number, cell size, and glycolytic rate
A) Cell accumulation in culture increases with higher concentrations of IL-3. The concentration of cells was measured over three days in culture with 0.01, 0.05, or 0.35 ng/ml of IL-3. Average of eight independent experiments ± sem is shown. B) Cell size increases throughout the cell cycle with higher concentrations of IL-3. Unfixed cells were stained with the cell permeable DNA dye Hoechst 33342 to measure cell cycle as well as propidium iodide to measure viability. Viable cells were analyzed for cell cycle, and a histogram of the forward scatter values of cells in either G1 or G2/M was plotted. A representative experiment is shown. C) Glycolytic rate increases dramatically when the concentration of IL-3 is increased. Glycolytic rate was measured by the specific conversion of glucose to water. Average of three independent experiments ± sem is shown.
Figure 2
Figure 2. IL-3 stimulation results in activation of glycolysis at multiple steps
A) ells grown in higher concentrations of IL-3. The Glut1 content of cells was measured via flow cytometry. A representative experiment is shown. B) Hexokinase activity increases in cells grown in higher concentrations of IL-3. Hexokinase activity was determined in whole cell lysates by a spectrophotometric assay in which glucose 6-phosphate formation is coupled to NADPH production. Average of four independent experiments ± sem is shown. The mean hexokinase activity was significantly greater for cells stimulated with 0.35 than for 0.01 ng/ml IL-3 (paired t test, two-tailed P value, P < 0.01). C) Phosphofructokinase-1 (PFK-1) activity increases in cells grown in higher concentrations of IL-3. PFK-1 activity was determined in whole-cell lysates by a spectrophotometric assay in which fructose 1,6-bisphosphate formation was coupled to NADH consumption. Average of five independent experiments ± sem is shown. The mean PFK-1 activity was significantly greater for cells stimulated with 0.35 than for 0.01 ng/ml IL-3 (paired t test, two-tailed P value, P < 0.05).
Figure 3
Figure 3. IL-3 stimulates a shift away from oxidative toward glycolytic metabolism
A) NADH levels were measured in a spectrofluorometer with constant stirring at an excitation wavelength of 340 nm and an emission wavelength of 461 nm. Drugs were added at the indicated times. The final concentrations of FCCP and rotenone were each 5 μM; the final concentration of IAA was 1 μM; the final concentration of KCN was 500 μM. A representative experiment is shown. B) Mitochondrial membrane potential rises with increasing concentrations of IL-3. Mitochondrial membrane potential was measured by flow cytometry using the potentiometric dye TMRE, and baseline TMRE staining was measured in cells treated with the uncoupling agent CCCP. The difference between these measurements was calculated and normalized to mitochondrial membrane potential determined in 0.01 ng/ml IL-3. Average of three independent experiments ± sem is shown. The mean mitochondrial membrane potential was significantly greater for cells stimulated with 0.35 than for 0.01 ng/ml IL-3 (paired t test, two-tailed P value, P < 0.05). C) The oxygen:glucose metabolism ratio declines with increasing concentrations of IL-3. The oxygen:glucose metabolism ratio was calculated by dividing the rate of oxygen consumption by the rate of glycolysis. Oxygen consumption rate was measured using an oxygen electrode in a heated, airtight chamber. Glycolytic rate was measured by the specific conversion of glucose to water. Average of three independent experiments ± sem is shown.
Figure 4
Figure 4. Lactate production increases as cells are grown in higher concentrations of IL-3
Cells were cultured in 0.01, 0.05, or 0.35 ng/ml IL-3 for three days. A) Cells consume more of the glucose in their media when grown in higher concentrations of IL-3. Average of at least four independent experiments ± sem is shown. B) Lactate accumulation in the media increases as cells are grown in higher concentrations of growth factor. Average of at least four independent experiments ± sem is shown. C) The amount of lactate produced per glucose consumed increases as cells are grown in higher concentrations of IL-3. Lactate production data were divided by glucose consumption data. The theoretical maximum, if all glucose were converted into lactate, is 1 mg of lactate produced per 1 mg of glucose consumed.
Figure 5
Figure 5. IL-3 increases glycolysis independently of changes in cell size
Cells cultured in 0.01 ng/ml IL-3 were switched to media containing 0.35 ng/ml IL-3 for four hours, with or without 5 μg/ml cycloheximide (CHX), or kept in 0.01 ng/ml IL-3. A) Cell growth stimulation by IL-3 is prevented by CHX. After four hours in the new media, cell size was measured by Coulter analysis. Average of four independent experiments ± sem is shown, normalized to cell size in cells maintained in 0.01 ng/ml IL-3. The mean cell size was significantly greater for cells stimulated with 0.35 than for 0.01 ng/ml IL-3 (paired t test, two-tailed P value, P < 0.01). B) PFK-1 activity stimulation by IL-3 is not prevented by CHX. After four hours, PFK-1 activity in whole-cell lysates was measured. Average of four independent experiments ± sem is shown, normalized to PFK-1 activity in cells maintained in 0.01 ng/ml IL-3. C) Glycolytic rate stimulation by IL-3 is not prevented by CHX. After four hours, glycolytic rate was measured by the specific conversion of glucose to water. Average of four independent experiments ± sem is shown, normalized to glycolytic rate of cells maintained in 0.01 ng/ml IL-3.
Figure 6
Figure 6. Glycolytic regulation is independent of cell growth control
A, B) Human primary T cells were stimulated for four hours with IL-2 in the presence or absence of cycloheximide. A) Cell size was measured by Coulter analysis. Average of three independent experiments ± sem is shown, normalized to cell size of cells unstimulated with IL-2. The mean cell size was significantly greater for cells stimulated with IL-2 (paired t test, two-tailed P value, P < 0.05). B) Glycolytic rate was measured by the specific conversion of glucose to water. Average of three independent experiments ± sem is shown, normalized to glycolytic rate of cells unstimulated with IL-2. C, D) B23 cells, immortalized murine B cell progenitors, were stimulated for four hours with IL-7 in the presence or absence of cycloheximide. C) Cell size was measured by Coulter analysis. Average of four independent experiments ± sem is shown, normalized to cell size of cells unstimulated with IL-7. The mean cell size was significantly greater for cells stimulated with IL-7 (paired t test, two-tailed P value, P < 0.001). D) Glycolytic rate was measured by the specific conversion of glucose to water. Average of four independent experiments ± sem is shown, normalized to glycolytic rate of cells unstimulated with IL-7.
Figure 7
Figure 7. IL-3 directed glycolysis suppresses cellular oxygen consumption and exceeds proliferative demand
Cells were cultured in 0.35 ng/ml IL-3 and 10 or 0.4 mM glucose. A) Glycolytic rate is suppressed when cells are shifted from 10 mM glucose to 0.4 mM glucose. Glycolytic rate was measured after two days in culture by measuring the specific conversion of tritiated glucose to tritiated water. Average of three independent experiments ± sem is shown. B) Oxygen consumption rate is derepressed when cells are shifted from 10 mM glucose to 0.4 mM glucose. Oxygen consumption was measured after two days in culture using an oxygen electrode in a heated, airtight chamber. Average of three independent experiments ± sem is shown. C) Cell accumulation in culture is maintained when cells are shifted from 10 mM glucose to 0.4 mM glucose. The concentration of cells was measured after three days in culture. Average of three independent experiments ± sem is shown. D) Cell size is maintained when cells are shifted from 10 mM glucose to 0.4 mM glucose. Cell size was measured after two days in culture by Coulter analysis. Average of three independent experiments ± sem is shown.
Figure 8
Figure 8. IL-3 directs glycolysis in parallel to growth and proliferation
Growth factors independently but coordinately regulate multiple processes in metazoan cells, including growth and proliferation. Data presented here suggest that glycolysis is another extrinsically directed process. Glycolysis is regulated at numerous steps, including glucose transport (GLUT1), hexokinase (HK), phosphofructokinase-1 (PFK-1), and lactate dehydrogenase. Furthermore, IL-3 stimulates a shift away from oxidative toward glycolytic metabolism. Elevation of glycolytic rates inhibits mitochondrial oxygen consumption below maximal levels, implying that mitochondrial metabolism is a homeostatic sensor of intracellular bioenergetics.

References

    1. Conlon I, Raff M. Size control in animal development. Cell. 1999;96:235–244. - PubMed
    1. Cooper EH, Barkhan P, Hale AJ. Observations on the proliferation of human leucocytes cultured with phytohaemagglutinin. Br J Haematol. 1963;9:101–111. - PubMed
    1. Hedeskov CJ. Early effects of phytohaemagglutinin on glucose metabolism of normal human lymphocytes. Biochem J. 1968;110:373–380. - PMC - PubMed
    1. Sagone AL, Jr, LoBuglio AF, Balcerzak SP. Alterations in hexose monophosphate shunt during lymphoblastic transformation. Cell Immunol. 1974;14:443–452. - PubMed
    1. Roos D, Loos JA. Changes in the carbohydrate metabolism of mitogenically stimulated human peripheral lymphocytes. I Stimulation by phytohaemagglutinin. Biochim Biophys Acta. 1970;222:565–582. - PubMed

Publication types

MeSH terms

LinkOut - more resources