

Performance characteristics of the immunoglobulin G-capture BED-enzyme immunoassay, an assay to detect recent human immunodeficiency virus type 1 seroconversion
- PMID: 15184443
- PMCID: PMC427871
- DOI: 10.1128/JCM.42.6.2623-2628.2004
Performance characteristics of the immunoglobulin G-capture BED-enzyme immunoassay, an assay to detect recent human immunodeficiency virus type 1 seroconversion
Abstract
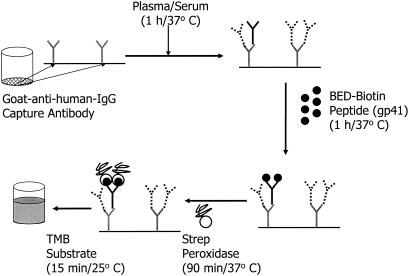
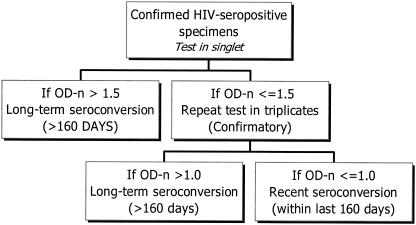
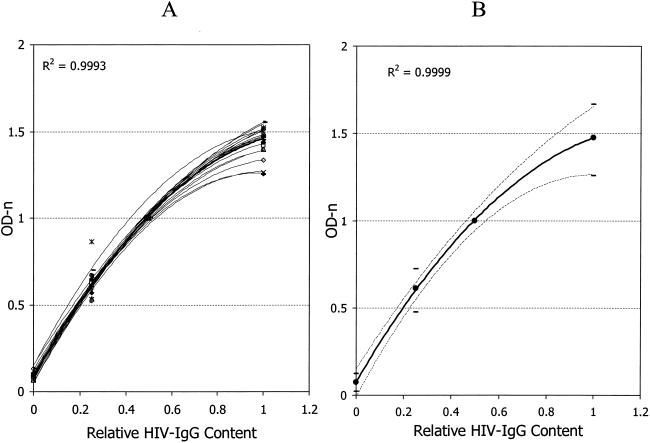
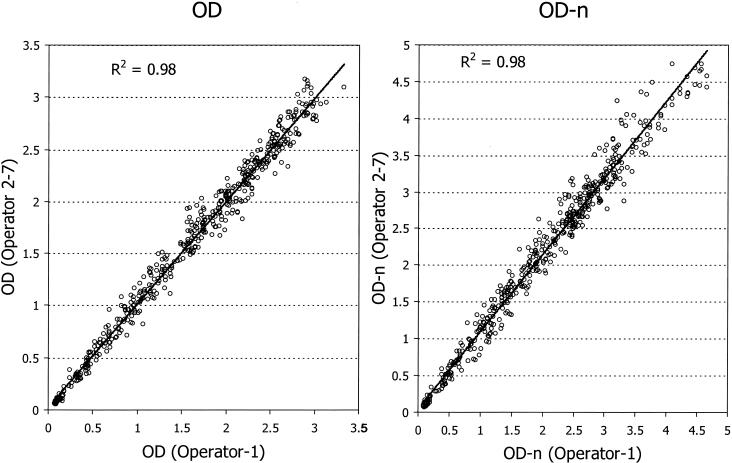
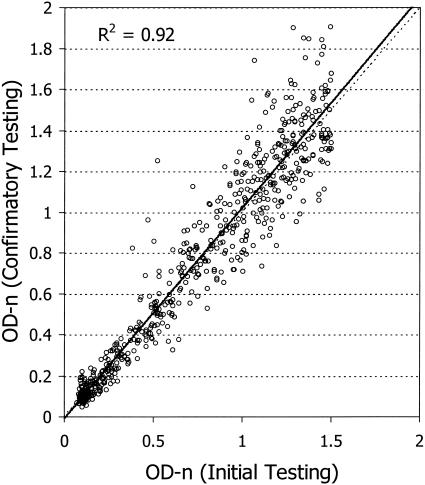
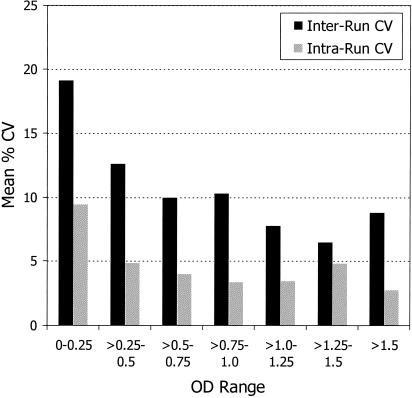
Recently, we developed an immunoglobulin G (IgG)-capture BED-enzyme immunoassay (BED-CEIA) to identify recent human immunodeficiency virus (HIV) type 1 (HIV-1) seroconversion for use in incidence estimates. We have established an algorithm for its use; developed quality control reagents to monitor the assay; and evaluated its performance for interrun, intrarun, and operator variability. Analysis of 144 individual plates, which involved multiple plate lots and several operators over more than a year, indicated that the coefficients of variation (CVs) were between 10 and 15% for raw optical density (OD) values in the dynamic range between 0.5 and 2.0 OD units; the CVs decreased to 5 to 10% when the OD was normalized (OD-n; OD-n = specimen OD/calibrator OD). The intrarun CVs were generally in the range of 5 to 10% for specimens with ODs <0.5 and less than 5% for specimens with ODs >0.5. The level of concordance between multiple plate lots (n = 6) and multiple operators (n = 7) was quite high (R(2) > 0.9). Comparison of the results of the initial and the confirmatory tests with specimens with OD-n values </=1.5 demonstrated a high degree of correlation (R(2) = 0.92); 566 (92%) of 615 of specimens tested in the two modes retained the same classification (recent or long-term infection). The values for those specimens with changed classifications (n = 49) were close to the cutoff (OD-n = 1.0), as expected. The twofold difference in the HIV IgG contents between the controls and the calibrator reagents was exploited to monitor individual plate runs by using a control plot, which was incorporated into the spreadsheet for data entry and run monitoring. This information provides baseline data for the successful transfer of BED-CEIA to other laboratories and the use of BED-CEIA for the detection of recent HIV seroconversion and the calculation of incidence estimates worldwide.
Figures
References
-
- Courouce, A. M., F. Barin, M. Maniez, C. Janot, L. Noel, M. H. Elghouzzi, et al. 1992. Effectiveness of assays for antibodies to HIV and p24 antigen to detect very recent HIV infections in blood donors. AIDS 6:1548-1550. - PubMed
-
- Janssen, R. S., G. A. Satten, S. L. Stramer, B. D. Rawal, T. R. O'Brien, B. J. Weiblen, F. M. Hecht, N. Jack, F. R. Cleghorn, J. O. Kahn, M. A. Chesney, and M. P. Busch. 1998. New testing strategy to detect early HIV-1 infection for use in incidence estimates and for clinical and prevention purposes. JAMA 280:42-48. - PubMed
-
- Kothe, D., R. H. Byers, S. P. Caudill, G. A. Satten, R. J. Janssen, H. Hannon, and J. V. Mei. 2003. Performance characterstics of a new less-sensitive HIV-1 EIA for use in estimating HIV seroincidence. J. Acquir. Immune Defic. Syndr. 33:625-634. - PubMed
-
- More, D., K. O'Brien, and E. Walter. 2000. Utility of an HIV-1 RNA assay in the diagnosis of acute retroviral syndrome. South. Med. J. 93:1004-1006. - PubMed
-
- Murphy, G., J. V. Parry, S. B. Gupta, C. Graham, L. F. Jordan, A. N. Nicoll, and O. N. Gill. 2001. Test of HIV incidence shows continuing HIV transmission in homosexual/bisexual men in England and Wales. Communicable Dis. Public Health 4:33-37. - PubMed
MeSH terms
Substances
LinkOut - more resources
Full Text Sources
Other Literature Sources
