. 2004 Jun 7;199(11):1595-605.
doi: 10.1084/jem.20031111.

Tumor rejection induced by CD70-mediated quantitative and qualitative effects on effector CD8+ T cell formation

Affiliations

Tumor rejection induced by CD70-mediated quantitative and qualitative effects on effector CD8+ T cell formation

Ramon Arens et al. J Exp Med. .

Abstract

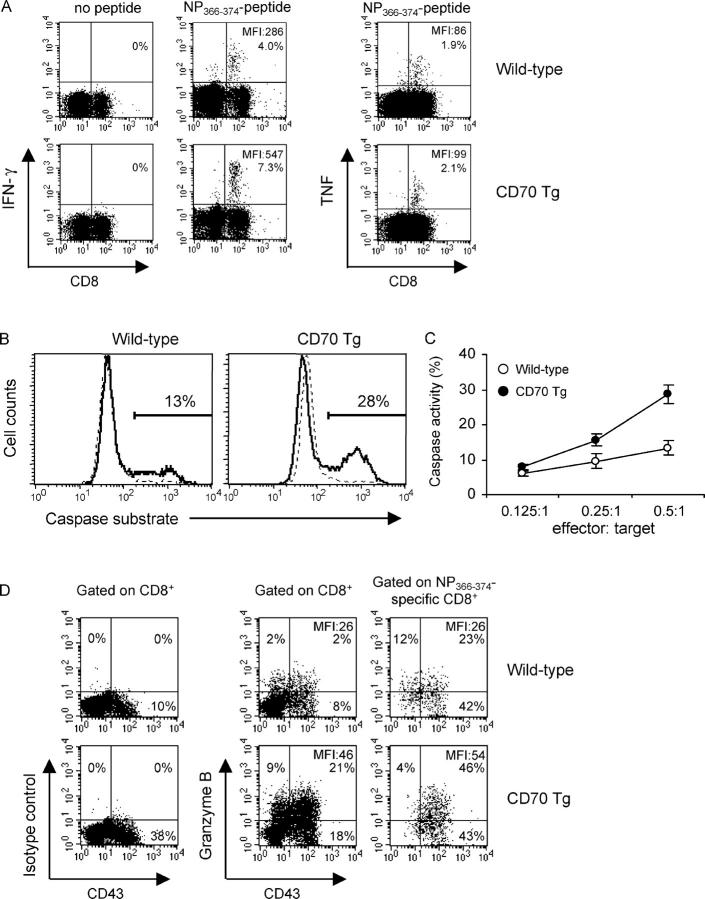
In vivo priming of antigen-specific CD8+ T cells results in their expansion and differentiation into effector T cells followed by contraction into a memory T cell population that can be maintained for life. Recent evidence suggests that after initial antigenic stimulation, the magnitude and kinetics of the CD8+ T cell response are programmed. However, it is unclear to what extent CD8+ T cell instruction in vivo is modulated by costimulatory signals. Here, we demonstrate that constitutive ligation of the tumor necrosis factor receptor family member CD27 by its ligand CD70 quantitatively augments CD8+ T cell responses to influenza virus infection and EL-4 tumor challenge in vivo by incrementing initial expansion and maintaining higher numbers of antigen-specific T cells in the memory phase. Concomitantly, the quality of antigen-specific T cells improved as evidenced by increased interferon (IFN)-gamma production and a greater cytotoxic potential on a per cell basis. As an apparent consequence, the superior effector T cell formation induced by CD70 protected against a lethal dose of poorly immunogenic EL4 tumor cells in a CD8+ T cell- and IFN-gamma-dependent manner. Thus, CD70 costimulation enhances both the expansion and per cell activity of antigen-specific CD8+ T cells.


Figures

Figure 1.
Figure 1.
Increased generation of antigen-specific CD8+ T cells in CD70 Tg mice after influenza virus infection. Wild-type and CD70 Tg mice were infected intranasally with influenza virus. (A) Representative FACS® profiles of blood cells collected at day 0 and at day 9 after infection showing H-2Db-NP366-374 tetramer staining versus CD8. Numbers indicate the percentages of H-2Db-NP366-374–specific cells within the CD8+ T cell compartment. No cells were stained with Moloney virus–specific (H-2Db-GagL85-93) tetramers (not depicted). (B) Frequency of H2-Db-NP366-374 tetramer positive cells among CD8+ T cells in blood at the indicated days after influenza virus infection. Data represent mean values and standard error from 10 mice per group. Significance of differences was determined by two-tailed Student's t test (*, P < 0.05; **, P < 0.005). (C) Expansion and contraction of NP366-374-specific CD8+ T cells in blood was normalized to the peak of the response (at day 9). (D) Absolute numbers of NP366-374-specific and (E) PA224-233-specific CD8+ T cells in spleens, DLNs, and lungs 9 d after infection. Data representing the mean and standard error from six mice per group are shown. Significance of differences was determined by two-tailed Student's t test (*, P < 0.05; **, P < 0.005). Both groups of mice showed no difference in kinetics of viral clearance. (F) Contraction of antigen-specific CD8+ T cells in the spleen was normalized to the peak of the response (at day 9).
Figure 2.
Figure 2.
Increased effector CD8+ T cells in NP-specific TCR Tg × CD70 Tg mice. F5 TCR Tg and F5 TCR Tg × CD70 Tg mice were infected intranasally with influenza virus. (A) Frequency of CD43hi-expressing CD8+ T cells in blood at the indicated days after influenza virus infection. Data represent mean values and standard error of five mice per group. Significance of differences was determined by two-tailed Student's t test (*, P < 0.05; **, P < 0.005). (B) Representative FACS® profiles of spleen, lung, and DLNs collected at day 9 after influenza virus infection showing CD43 staining on gated CD8+ T cells of TCR Tg mice (shaded histograms) and TCR Tg × CD70 Tg mice (solid lines). Numbers indicate the percentage of CD43hi cells within the CD8+ T cell compartment. (C) Absolute numbers of CD43hiCD8+ T cells in spleen, lung, and DLNs at day 9 after infection. Data represent mean values and standard error of five mice per group. Significance of differences was determined by two-tailed Student's t test (**, P < 0.005).
Figure 3.
Figure 3.
CD70-mediated effects on antigen-specific CD8+ T cell responses require CD27 stimulation during antigen encounter. (A) Wild-type, CD27−/−, CD70 Tg, and CD27−/− × CD70 Tg mice were infected intranasally with influenza virus. At day 9 after infection, spleens were collected, and absolute numbers of NP366-374-specific CD8+ T cells were determined. (B) Reduced CD27 expression on T cells in CD70 Tg × TCR Tg mice requires continuous triggering by CD70. Splenic CD8+ T cells from F5 TCR Tg mice and F5 TCR Tg × CD70 Tg mice were purified and stained with mAbs specific for Vβ11 and CD27 (top). 1 d after adoptive transfer of 4 × 10⁶ purified CD8+ T cells from F5 TCR Tg mice and F5 TCR Tg × CD70 Tg mice into Ly5.1 mice, spleen cells were stained with mAbs specific for CD8, CD27, and Ly5.2 (bottom). Dot plots are gated on CD8+ T cells. (C) Purified CD8+ T cells from F5 TCR Tg mice and F5 TCR Tg × CD70 Tg mice were CFSE-labeled and adoptively transferred into Ly5.1 recipient mice. At 1 d after transfer, mice were infected with influenza virus. 4 d after virus infection, DLN cells were stained with mAbs specific for CD8 and Ly5.2. Flow cytometric histograms of CFSE dilution on CD8 and Ly5.2-positive cells are shown.
Figure 4.
Figure 4.
Increased generation of NP-specific CD8+ T cells in CD70 Tg mice after EL4-NP tumor challenge. (A) Wild-type and CD70 Tg mice were challenged subcutaneously with 106 EL4-NP tumor cells, and tumor size was measured at the indicated days after tumor challenge. Data represent mean values and standard error of six mice per group. (B) Frequency of NP366-374-specific CD8+ T cells in blood of wild-type and CD70 Tg mice. Significance of differences was determined by two-tailed Student's t test (*, P < 0.05). (C) Absolute numbers of NP366-374-specific CD8+ cells in spleen and DLNs at day 13 after tumor challenge. Significance of differences was determined by two-tailed Student's t test (*, P < 0.05).
Figure 5.
Figure 5.
Increased IFN-γ production and cytotoxic activity in CD70 Tg mice. Phenotypic analysis of splenic CD8+ T cells of wild-type and CD70 Tg mice collected 12 d after challenge with 106 EL4-NP tumor cells. (A) Intracellular IFN-γ and TNF-α staining of NP366-374-specific CD8+ T cells. Intracellular IFN-γ and TNF-α levels were measured in spleen cells after 5 h of incubation in the presence or absence of NP366-374 peptide. The percentage and MFI of IFN-γ+ and TNF+ cells within the CD8+ gate are indicated. Background (no peptide) was <0.2%. (B) Cytotoxic activity of NP366-374-specific CD8+ T cells. Target cells (EL4 cells) were fluorescently labeled, pulsed with NP366-374 peptide or unpulsed, and subsequently cocultured with effector cells (NP366-374-specific CD8+ T cells) at different effector to target cell ratios in which effector populations from wild-type and CD70 Tg mice were equalized based on the percentage of NP-specific cells. Killing of target cells was assessed by a flow cytometric CTL assay detecting the induction of caspase activity in target cells. Histograms are gated on EL4 target cells, and the numbers indicate the percentage caspase positive cells. The solid and dotted lines represent peptide-pulsed or unpulsed target cells, respectively. (C) Measurement of cytotoxicity as described in B with different effector to target cell ratios. Data are displayed as mean and standard error (n = 5). (D) Ex vivo intracellular granzyme B staining. CD8+ T cells and NP366-374-specific CD8+ T cells were stained for CD43 and intracellular granzyme B. Gated CD8+ and NP366-374-specific CD8+ T cells are shown. The numbers indicate the percentages of cells within the designated quadrant and are representative of five mice.
Figure 6.
Figure 6.
CD8+ T cell– and IFN-γ–dependent tumor rejection in CD70 Tg mice. Mice were challenged subcutaneously with 106 EL4 or EL4-GFP tumor cells. Tumors were measured, and mice were killed when tumors reached diameters of >15 mm. (A) EL4 and (B) EL4-GFP tumor rejection in CD70 Tg mice. Tumor size of wild-type and CD70 Tg mice was measured at the indicated days after tumor challenge. Data represent mean values and standard error of eight mice per group. (C) Increased frequencies of CD8+ T cells and tumor specific-CD8+ T cells in spleen and tumors after EL4-GFP challenge as determined using anti-CD8 mAbs and H-2Db-GagL85-93 tetramers at day 9 after tumor challenge. (D) CD8+ T cell infiltrates (red) in EL4-GFP tumors (blue) from wild-type and CD70 Tg mice at day 9 after tumor challenge as determined by immunohistochemistry. (E) CD8+ T cells are critically involved in EL4 tumor rejection in CD70 Tg mice. Tumor size was measured at the indicated days after EL4 tumor challenge in mice treated with either anti-CD4 or anti-CD8 mAbs. Data represent mean values and standard error from five mice per group. (F) IFN-γ is critically involved in EL4 tumor rejection in CD70 Tg mice. Tumor size of IFN-γ−/− and IFN-γ−/− × CD70 Tg mice was measured at the indicated days after tumor challenge. Data represent mean and standard error from five mice per group.

References

    1. Sprent, J., and C.D. Surh. 2002. T cell memory. Annu. Rev. Immunol. 20:551–579. - PubMed
    1. Wong, P., and E.G. Pamer. 2003. CD8 T cell responses to infectious pathogens. Annu. Rev. Immunol. 21:29–70. - PubMed
    1. Ahmed, R., and D. Gray. 1996. Immunological memory and protective immunity: understanding their relation. Science. 272:54–60. - PubMed
    1. Kaech, S.M., E.J. Wherry, and R. Ahmed. 2002. Effector and memory T-cell differentiation: implications for vaccine development. Nat. Rev. Immunol. 2:251–262. - PubMed
    1. Mercado, R., S. Vijh, S.E. Allen, K. Kerksiek, I.M. Pilip, and E.G. Pamer. 2000. Early programming of T cell populations responding to bacterial infection. J. Immunol. 165:6833–6839. - PubMed

Publication types

MeSH terms