

Development of insulin resistance and obesity in mice overexpressing cellular glutathione peroxidase
- PMID: 15184668
- PMCID: PMC428436
- DOI: 10.1073/pnas.0308096101
Development of insulin resistance and obesity in mice overexpressing cellular glutathione peroxidase
Abstract
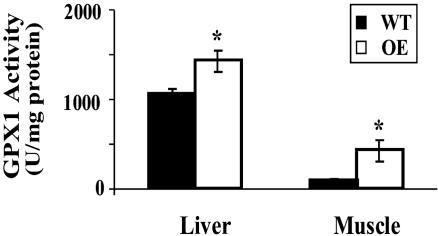
Insulin resistance, a hallmark of type 2 diabetes, is associated with oxidative stress. However, the role of reactive oxygen species or specific antioxidant enzymes in its development has not been tested under physiological conditions. The objective of our study was to investigate the impact of overexpression of glutathione peroxidase 1 (GPX1), an intracellular selenoprotein that reduces hydrogen peroxide (H(2)O(2)) in vivo, on glucose metabolism and insulin function. The GPX1-overexpressing (OE) and WT male mice (n = 80) were fed a selenium-adequate diet (0.4 mg/kg) from 8 to 24 weeks of age. Compared with the WT, the OE mice developed (P < 0.05) hyperglycemia (117 vs. 149 mg/dl), hyperinsulinemia (419 vs. 1,350 pg/ml), and elevated plasma leptin (5 vs. 16 ng/ml) at 24 weeks of age. Meanwhile, these mice were heavier (37 vs. 27 g, P < 0.001) and fatter (37% vs. 17% fat, P < 0.01) than the WT mice. At 30-60 min after an insulin challenge, the OE mice had 25% less (P < 0.05) of a decrease in blood glucose than the WT mice. Their insulin resistance was associated with a 30-70% reduction (P < 0.05) in the insulin-stimulated phosphorylations of insulin receptor (beta-subunit) in liver and Akt (Ser(473) and Thr(308)) in liver and soleus muscle. Here we report the development of insulin resistance in mammals with elevated expression of an antioxidant enzyme and suggest that increased GPX1 activity may interfere with insulin function by overquenching intracellular reactive oxygen species required for insulin sensitizing.
Figures


Similar articles
-
Interference of selenium and selenoproteins with the insulin-regulated carbohydrate and lipid metabolism.Free Radic Biol Med. 2013 Dec;65:1538-1547. doi: 10.1016/j.freeradbiomed.2013.07.016. Epub 2013 Jul 18. Free Radic Biol Med. 2013. PMID: 23872396 Review.
-
Hepatocyte glutathione peroxidase-1 deficiency improves hepatic glucose metabolism and decreases steatohepatitis in mice.Diabetologia. 2016 Dec;59(12):2632-2644. doi: 10.1007/s00125-016-4084-3. Epub 2016 Sep 15. Diabetologia. 2016. PMID: 27628106
-
Fatty acid-induced insulin resistance: decreased muscle PI3K activation but unchanged Akt phosphorylation.J Clin Endocrinol Metab. 2002 Jan;87(1):226-34. doi: 10.1210/jcem.87.1.8187. J Clin Endocrinol Metab. 2002. PMID: 11788651
-
Disruption of the SH2-B gene causes age-dependent insulin resistance and glucose intolerance.Mol Cell Biol. 2004 Sep;24(17):7435-43. doi: 10.1128/MCB.24.17.7435-7443.2004. Mol Cell Biol. 2004. PMID: 15314154 Free PMC article.
-
Selenium and diabetes--evidence from animal studies.Free Radic Biol Med. 2013 Dec;65:1548-1556. doi: 10.1016/j.freeradbiomed.2013.07.012. Epub 2013 Jul 16. Free Radic Biol Med. 2013. PMID: 23867154 Free PMC article. Review.
Cited by
-
Dietary Selenium Requirement for the Prevention of Glucose Intolerance and Insulin Resistance in Middle-Aged Mice.J Nutr. 2021 Jul 1;151(7):1894-1900. doi: 10.1093/jn/nxab053. J Nutr. 2021. PMID: 33830273 Free PMC article.
-
Dietary selenium deficiency partially rescues type 2 diabetes-like phenotypes of glutathione peroxidase-1-overexpressing male mice.J Nutr. 2012 Nov;142(11):1975-82. doi: 10.3945/jn.112.164764. Epub 2012 Sep 26. J Nutr. 2012. PMID: 23014491 Free PMC article.
-
GSH levels affect weight loss in individuals with metabolic syndrome and obesity following dietary therapy.Exp Ther Med. 2018 Aug;16(2):635-642. doi: 10.3892/etm.2018.6204. Epub 2018 May 23. Exp Ther Med. 2018. PMID: 30116319 Free PMC article.
-
Selenium and Type 2 Diabetes: Systematic Review.Nutrients. 2018 Dec 5;10(12):1924. doi: 10.3390/nu10121924. Nutrients. 2018. PMID: 30563119 Free PMC article.
-
The role of selenium in type-2 diabetes mellitus and its metabolic comorbidities.Redox Biol. 2022 Apr;50:102236. doi: 10.1016/j.redox.2022.102236. Epub 2022 Jan 24. Redox Biol. 2022. PMID: 35144052 Free PMC article. Review.
References
-
- Stumvoll, M. & Haring, H. (2001) Horm. Res. 55, 3–13. - PubMed
-
- Packer, L., Kraemer, K. & Rimbach, G. (2001) Nutrition 17, 888–895. - PubMed
-
- Rosen, P., Nawroth, P. P., King, G., Moller, W., Tritschler, H. J. & Packer, L. (2001) Diabetes Metab. Res. Rev. 17, 189–212. - PubMed
-
- Evans, J. L., Goldfine, I. D., Maddux, B. A. & Grodsky, G. M. (2002) Endocrine Rev. 23, 599–622. - PubMed
-
- Rotruck, J. T., Pope, A. L., Ganther, H. E., Swanson, A. B., Hafeman, D. G. & Hoekstra, W. G. (1973) Science 179, 588–590. - PubMed
Publication types
MeSH terms
Substances
Grants and funding
LinkOut - more resources
Full Text Sources
Other Literature Sources
Medical
Molecular Biology Databases
Miscellaneous
