

Meta-analysis of 13 genome scans reveals multiple cleft lip/palate genes with novel loci on 9q21 and 2q32-35
- PMID: 15185170
- PMCID: PMC1216052
- DOI: 10.1086/422475
Meta-analysis of 13 genome scans reveals multiple cleft lip/palate genes with novel loci on 9q21 and 2q32-35
Abstract
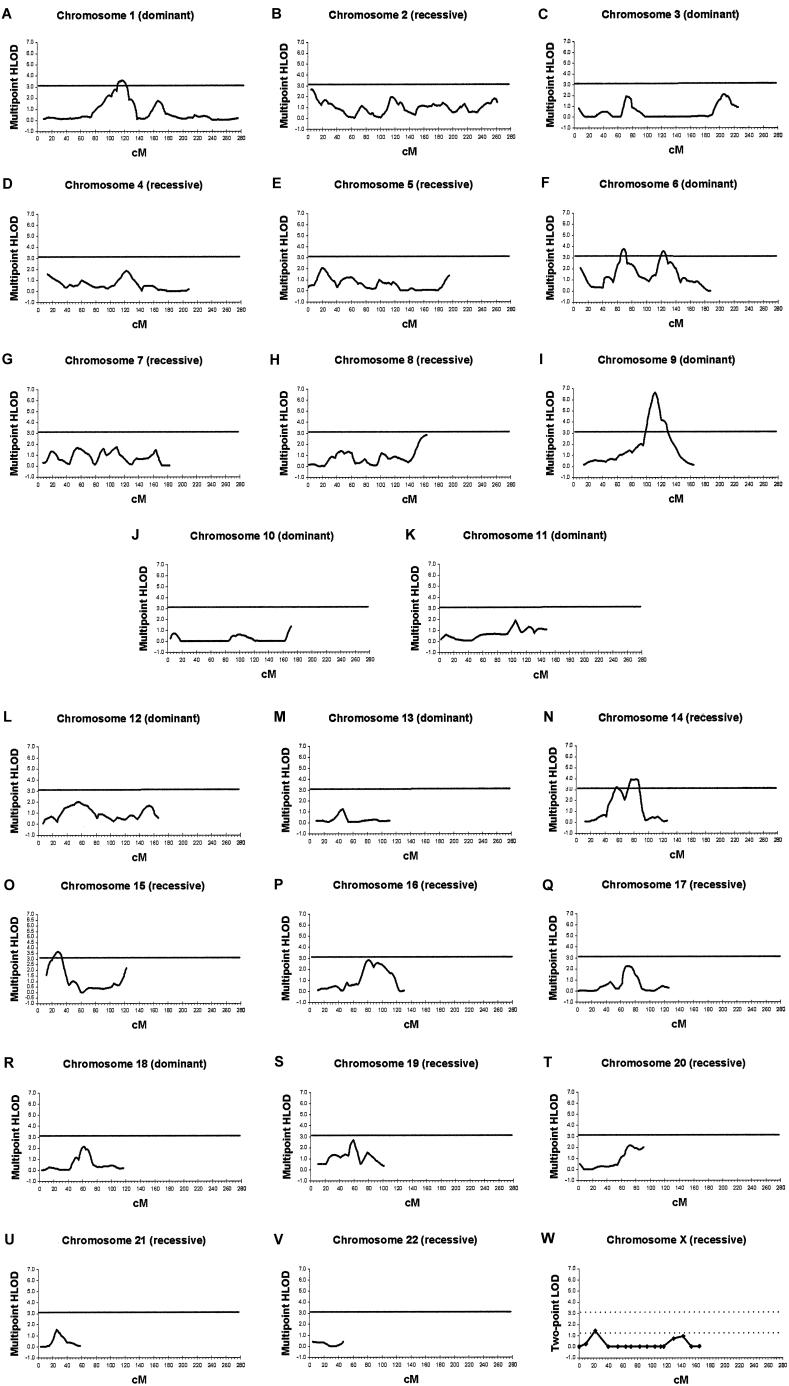
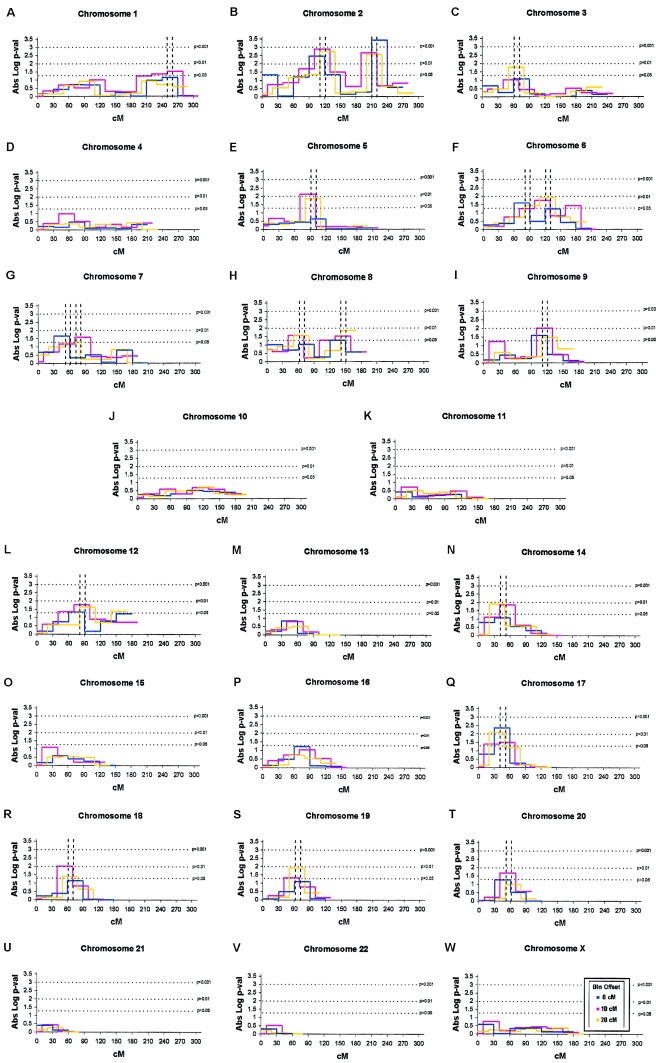
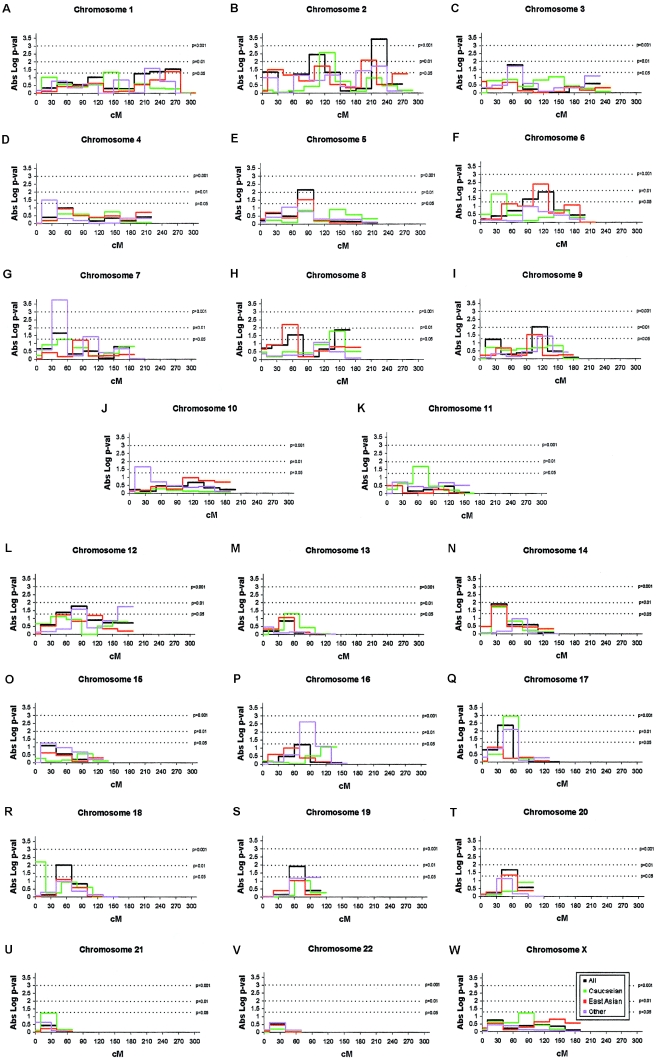
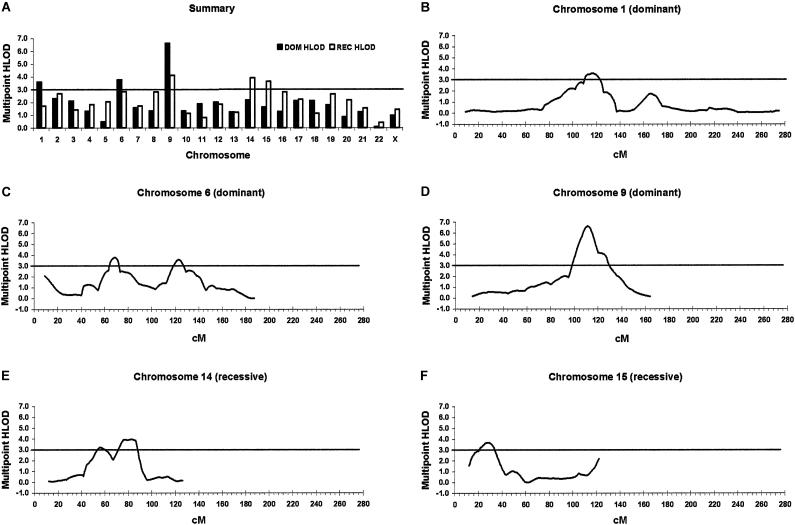
Isolated or nonsyndromic cleft lip with or without cleft palate (CL/P) is a common birth defect with a complex etiology. A 10-cM genome scan of 388 extended multiplex families with CL/P from seven diverse populations (2,551 genotyped individuals) revealed CL/P genes in six chromosomal regions, including a novel region at 9q21 (heterogeneity LOD score [HLOD]=6.6). In addition, meta-analyses with the addition of results from 186 more families (six populations; 1,033 genotyped individuals) showed genomewide significance for 10 more regions, including another novel region at 2q32-35 (P=.0004). These are the first genomewide significant linkage results ever reported for CL/P, and they represent an unprecedented demonstration of the power of linkage analysis to detect multiple genes simultaneously for a complex disorder.
Figures
References
Electronic-Database Information
-
- Center for Inherited Disease Research (CIDR), http://www.cidr.jhmi.edu/
-
- Center for Medical Genetics, http://research.marshfieldclinic.org/genetics/ (for the Marshfield Mammalian Genotyping Service)
-
- Online Mendelian Inheritance in Man (OMIM), http://www.ncbi.nlm.nih.gov/Omim (for VDWS, MSX1, Gorlin syndrome, and OFC1)
References
-
- Berk NW, Marazita ML (2002) Costs of cleft lip and palate: personal and societal implications. In: Wyszynski DF (ed) Cleft lip and palate: from origin to treatment. Oxford University Press, Oxford, pp 458–467
Publication types
MeSH terms
Substances
Grants and funding
- P60-DE-13078/DE/NIDCR NIH HHS/United States
- R01-DE-12472/DE/NIDCR NIH HHS/United States
- R01 DE014667/DE/NIDCR NIH HHS/United States
- R01-DE-14667/DE/NIDCR NIH HHS/United States
- R01 DE016148/DE/NIDCR NIH HHS/United States
- R01-DE-08559/DE/NIDCR NIH HHS/United States
- R01 DE008559/DE/NIDCR NIH HHS/United States
- M01 RR000084/RR/NCRR NIH HHS/United States
- K02 DE015291/DE/NIDCR NIH HHS/United States
- R01 DE009886/DE/NIDCR NIH HHS/United States
- P60-DE13076/DE/NIDCR NIH HHS/United States
- P60 DE013078/DE/NIDCR NIH HHS/United States
- P60-DE-13076/DE/NIDCR NIH HHS/United States
- RR-00084/RR/NCRR NIH HHS/United States
- R01-DE-09886/DE/NIDCR NIH HHS/United States
- P60 DE013076/DE/NIDCR NIH HHS/United States
LinkOut - more resources
Full Text Sources
Medical
Miscellaneous
