

Review
doi: 10.1186/gb-2004-5-6-227.
Epub 2004 May 27.
Root genomics: towards digital in situ hybridization
Affiliations
- PMID: 15186485
- PMCID: PMC463066
- DOI: 10.1186/gb-2004-5-6-227
Item in Clipboard
Review
Root genomics: towards digital in situ hybridization
Genome Biol.
2004.
Abstract
Separation of cell types and developmental stages in the Arabidopsis root and subsequent expression profiling have yielded a valuable dataset that can be used to select candidate genes for detailed study and to start probing the complexities of gene regulation in plant development.
Figures
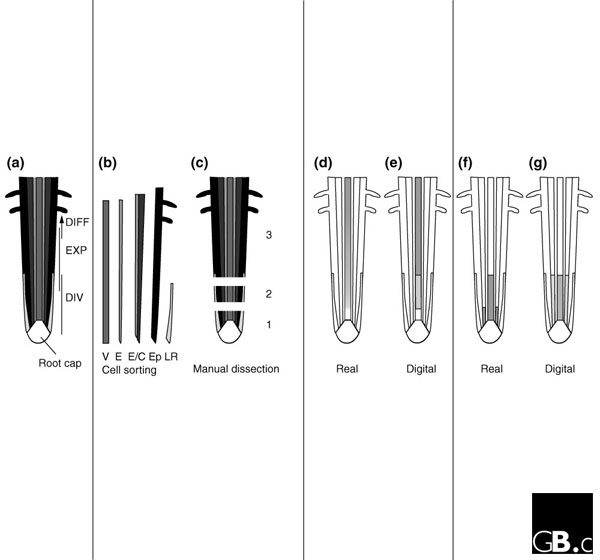
Dissection of gene-expression domains in the Arabidopsis root. (a) Schematic overview of the root. DIV, cell division zone; EXP, zone of rapid cell expansion; DIFF, zone of cell differentiation. (b) Tissue and cell types as sorted by fluorescence-activated cell sorting (FACS) in the study by Birnbaum et al. [5]. V, (pro-)vascular cells; E, endodermis; E/C, endodermis and cortex; Ep, epidermis; LR, lateral root cap. (c) Manually dissected regions, also used in [5]. (d) Gene-expression patterns that are distributed in a graded manner through the developmental stages become discrete in (e) the 'digital in situ' representation. (f) The expression pattern of genes expressed in distinct zones that differ per tissue type becomes averaged in (g) the digital version throughout the tissues and stages.
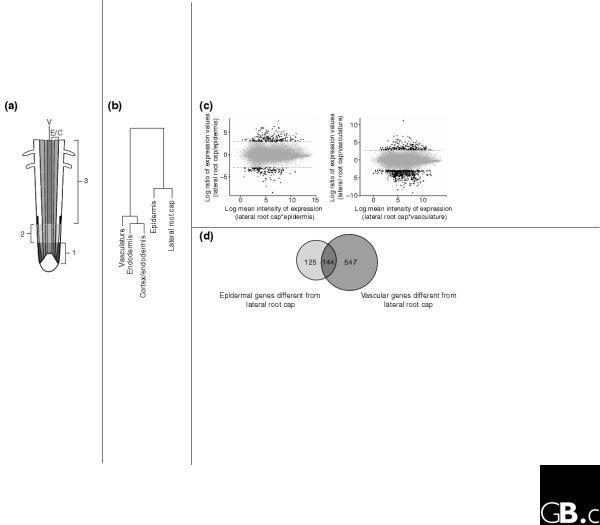
Global analysis of gene expression in the root. (a) Major clusters of co-expressed genes called localized expression domains (LEDs) from the analysis by Birnbaum et al. [5]. V, vascular tissue; E/C, endodermis and cortex. 1,2 and 3 refer to the dissection zones in Figure 1c. (b-d) Our own analysis of the data from [5]. (b) A similarity tree calculated from the data in [5] using Euclidian distance with complete linkage. For all five tissues, all genes were taken as coordinates, resulting in five points in a multidimensional space. The Euclidian geometric distance between these points was calculated. To obtain the clustering, the points closest in space (vasculature and cortex/endodermis) were defined as the first cluster. All other points are subsequently added to this cluster based on the point furthest away inside the cluster. (c) Two cluster diagrams showing the similarity between tissue types using the Canberra similarity measure with complete linkage (see [16]). For all five tissues, all genes were compared using a similarity measure between experiments. Cell types were compared using log ratio of expression values (m = log2 (tissue a/tissue b)) versus log mean intensity of expression (a = log2 (tissue a * tissue b)/2) plots using the R statistical language [17,18]. After transforming the data, linearity was corrected using the Loess function, and further analysis was done on residuals. The two tissues resembling each other most (lateral root cap and epidermis) and least (vasculature and lateral root cap) in the dendrograms are analyzed. The threshold for differential expression is three times the standard deviation of the experiment with the least variance (lateral root cap versus epidermis) on both scatter plots (dotted lines). Differentially regulated genes are shown as filled circles outside the dotted lines. (d) Numbers of genes differentially regulated under these restrictions shown as a Venn diagram.
References
-
- Van Driessche N, Shaw C, Katoh M, Morio T, Sucgang R, Ibarra M, Kuwayama H, Saito T, Urushihara H, Maeda M, et al. A transcriptional profile of multicellular development in Dictyostelium discoideum. Development. 2002;129:1543–1552. - PubMed
Publication types
MeSH terms
LinkOut - more resources
Full Text Sources
