. 2004;5(6):R40.
doi: 10.1186/gb-2004-5-6-r40. Epub 2004 Jun 1.

A survey of ovary-, testis-, and soma-biased gene expression in Drosophila melanogaster adults

Affiliations

A survey of ovary-, testis-, and soma-biased gene expression in Drosophila melanogaster adults

Michael Parisi et al. Genome Biol. 2004.

Abstract

Background: Sexual dimorphism results in the formation of two types of individuals with specialized reproductive roles and is most evident in the germ cells and gonads.

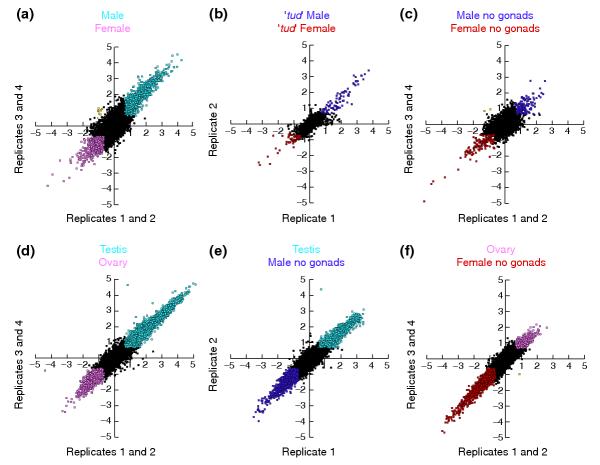
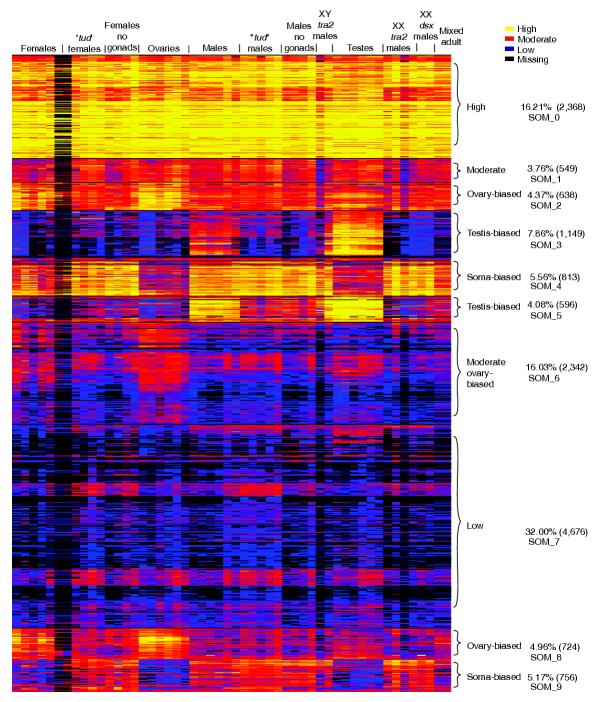
Results: We have undertaken a global analysis of transcription between the sexes using a 31,464 element FlyGEM microarray to determine what fraction of the genome shows sex-biased expression, what tissues express these genes, the predicted functions of these genes, and where these genes map onto the genome. Females and males (both with and without gonads), dissected testis and ovary, females and males with genetically ablated germlines, and sex-transformed flies were sampled.

Conclusions: Using any of a number of criteria, we find extensive sex-biased expression in adults. The majority of cases of sex differential gene expression are attributable to the germ cells. There is also a large class of genes with soma-biased expression. There is little germline-biased expression indicating that nearly all genes with germline expression also show sex-bias. Monte Carlo simulations show that some genes with sex-biased expression are non-randomly distributed in the genome.


Figures

Figure 1
Figure 1
Microarray experimental design. Sex biased gene expression data was derived from 44 microarray hybridizations testing 15 conditions. All experimental conditions included at least one biological replicate and most also include dye-flip hybridizations for additional replicates. Abbreviated genotypes of the samples are shown in light ellipses with the total number of replicated hybridizations in dark circles between the two samples. Full genotypes of the flies used are as follows: X/Y;tra2- males are w67c/BsY;tra2B/Df(2R)trix, X/X;tra2- sex transformed males are w67c/+;tra2B/Df(2R)trix, X/X;dsxD/dsx- males are (+/+; dsxM+R45/dsxswe. 'tud' males and females are the progeny of homozygous tud1 bw1 sp1 females mated to tud1 bw1 sp1/CyO males and themselves are genotypically tud1 bw1 sp1 homozygotes. Females and males are whole adult y1 w67c flies. Ovary, testis and no gonad samples are also derived from y1 w67c flies.
Figure 2
Figure 2
Sex-biased differential expression in Drosophila. Scatter plots show global expression in Drosophila testing different sex and tissue conditions. Data are pairwise comparisons of natural log (Ln) Cy3/Cy5 signal ratios averaged from dye flipped and biological replicate experiments. Black color indicates expression ratios that fall within a two-fold cutoff. Microarray element species greater than two-fold are color coded as indicated on each scatter plot. Yellow points indicate 2-fold differences that fail to correspond to the expression variables analyzed. The number of element species included in each pairwise comparison that met stringency conditions are indicated in parentheses. (a) y1 w67c males versus y1 w67c females (n = 10,688); (b) male versus female progeny of homozygous tud1 bw1 sp1 females (n = 12,836); (c)y1 w67c males, no gonads versus y1 w67 female, no gonads (n = 9,778); (d)y1 w67c testis versus y1 w67c ovary (n = 11,338); (e) y1 w67c testis versus y1 w67c y1 w67c male, no gonads (n = 12,461); (f) y1 w67c ovary versus y1 w67c female, no gonads (n = 11,223).
Figure 3
Figure 3
Heat diagram of intensities. Self organizing maps (SOMs) were used to generate an image of clustered intensity data from 26 pairwise experiments. The individual channels from these experiments are parsed out and arranged by tissue type as indicated in the top row text. The normalized intensities are indicated as high expression (yellow), moderate (red), low (blue) and missing value (below background; black). The diagram represents averaged data from the duplicated elements within each microarray. Brackets show ten SOM clusters with the tissue type and percentage of the total number of microarray elements in the right text column.
Figure 4
Figure 4
Northern and microarray comparison. A series of 75 Northern blots with total RNA from germline-less ('tud') male, wildtype (y1 w67c) male, germline-less ('tud') female and wildtype (y1 w67) female whole flies were probed with the PCR products identical to those printed as microarray elements. (a) 34 Northern blot images show a range of expression patterns among the input RNA samples. Phosphorimaging of the radioactive signal from Northern blots gave expression ratios between the RNA sample types for each Northern probe. (b-e) Corresponding (Ln) transformed Northern and microarray element ratios averaged from multiple experiments are shown as four scatterplots comparing expression between (b) y1 w67c males versus y1 w67c females; (c) 'tud' males versus 'tud' females; (d) y1 w67c males versus 'tud' males and (e) y1 w67c females versus 'tud' females. The y and x axes are expression ratios derived from Northern blot and microarray ratios respectively. Over two-, over four- and over tenfold differences in ratio values between the Northern and microarray experiments are indicated in yellow, red and blue.
Figure 5
Figure 5
Meta-analysis of Arbeitman et al. [20,36] data. (a,b) Scatterplots of averaged (Ln) ratios for (a) male versus female and (b) 'tud' male versus 'tud' female comparing data from experiments performed with the FlyGEM and GPL218 platforms. Two-fold sex-biased expression in both datasets are indicated in blue (male-biased) and pink (female-biased). Those showing two-fold male-biased expression in one data set, but two-fold female-biased expression in the other are shown in yellow. (c,d) Comparison of Northern expression ratios for 16 probes versus averaged (Ln) ratios from Arbeitman et al. are shown in scatterplots for (c) male versus female and (d) 'tud' male versus 'tud' female. The 16 probes represent CG13263, CG8994, CG3972, CG10701, CG1088, CG7961, G10961, CG6206, CG4586, CG13095, CG5089, CG4847, CG6483, CG8549, CG7660, CG6457. Two-, four- and 10-fold deviations from 1:1 ratio are indicated by yellow, red and blue color (see Figure 4). (e,f) Clustering of FlyGEM normalized intensity data was performed for sex-biased somatic genes from Table 2 of Arbeitman et al. [36]. (e) 33 male and (f) 26 female genes are shown as intensity heat clustergrams. The normalized intensities are indicated as high expression (yellow), moderate (red), low (blue) and below background (black). (Intensities are represented by color as in Figure 4). Columns show 52 channels parsed from 26 pairwise FlyGEM microarray experiments. Clustering shows soma-bias corroborating the Table 2 lists. The array element species represented in rows from top are listed as follows: (e) CG12268, CG3359, CG3359, CG3359, CG5740, CG7050, CG7157, CG7178, CG7178, CG7748, CG8110, CG8552, CG9456, CG12558, CG14024, CG15097, CG16820, CG17843, CG18284, CG3359, CG5411, CG5455, CG6518, CG6716, CG6844, CG7178, CG7178, CG7342, CG8708, CG8708, CG8909, CG9519; (f) CG10281, CG10566, CG1090, CG11248, CG12269, CG1646, CG17012, CG7129, CG7702, CG7899, CG8327, CG8370, CG9547, CG10944, CG12740, CG14792, CG18525, CG3195, CG3751, CG4087, CG5821, CG7777, CG8453, CG8705, CG9696, CG9699.
Figure 6
Figure 6
An analysis of Gene Ontology term categories. The results show categories over-represented in (a) ovary, (b) testis, (c) female soma and (d) male soma queried by the three GO ontologies of biological process (black bars), cellular component (dark gray bars) and molecular function (light gray bars). Histograms represent significant over-representation (P < 0.001) of element species for 116 GO categories. The y axis scale shows P-values of the modified F-statistic (EASE score). The GO terms for each column are: 1, behavior; 2, biosynthesis; 3, cell cycle; 4, cell growth and/or maintenance; 5, cell organization and biogenesis; 6, cell proliferation; 7, chromosome organization and biogenesis (sensu Eukarya); 8, cytoplasm organization and biogenesis; 9, cytoskeleton organization and biogenesis; 10, cytoskeleton-dependent intracellular transport; 11, DNA dependent DNA replication; 12, DNA metabolism; 13, DNA packaging; 14, DNA replication; 15, DNA replication and chromosome cycle; 16, eggshell formation; 17, eggshell formation (sensu Insecta); 18, establishment and/or maintenance of chromatin architecture; 19, G2/M transition of mitotic cell cycle; 20, gametogenesis; 21, insect chorion formation; 22, insemination; 23, intracellular transport; 24, M phase of mitotic cell cycle; 25, macromolecule biosynthesis; 26, mating behavior; 27, metabolism; 28, microtubule-based movement; 29, microtubule-based process; 30, mitotic cell cycle; 31, nuclear organization and biogenesis; 32, nucleobase, nucleoside, nucleotide and nucleic acid metabolism; 33, oogenesis; 34, oogenesis (sensu Insecta); 35, organelle organization and biogenesis; 36, ovarian follicle cell development (sensu Insecta); 37, oviposition; 38, physiological processes; 39, post-mating behavior; 40, protein biosynthesis; 41, protein metabolism; 42, protein modification; 43, proteolysis and peptidolysis; 44, regulation of cell cycle; 45, reproduction; 46, reproductive behavior; 47, S phase of mitotic cell cycle; 48, sexual reproduction; 49, sperm competition; 50, sperm displacement; 51, transport; 52, vitellogenesis; 53, cell; 54, chaperonin-containing T-complex; 55, cytoplasm; 56, cytoskeleton; 57, cytosol; 58, cytosolic large ribosomal subunit (sensu Eukarya); 59, cytosolic ribosome (sensu Eukarya); 60, cytosolic small ribosomal subunit (sensu Eukarya); 61, dynein complex; 62, eukaryotic 43S pre-initiation complex; 63, eukaryotic 48S initiation complex; 64, extracellular; 65, inner membrane; 66, intracellular; 67, large ribosomal subunit; 68, lysosome; 69, lytic vacuole; 70, membrane; 71, microtubule associated complex; 72, microtubule cytoskeleton; 73, mitochondrial inner membrane; 74, mitochondrial membrane; 75, mitochondrion; 76, pre-replicative complex; 77, replication fork; 78, ribonucleoprotein complex; 79, ribosome; 80, small ribosomal subunit; 81, alpha-mannosidase activity; 82, aminopeptidase activity; 83, ATP dependent helicase activity; 84, ATP dependent RNA helicase activity; 85, carbohydrate binding activity; 86, carrier activity; 87, catalytic activity; 88, chaperone activity; 89, chromatin binding; 90, chymotrypsin activity; 91, dynein ATPase activity; 92, endopeptidase activity; 93, enzyme activity; 94, exopeptidase activity; 95, galactose binding activity; 96, hormone activity; 97, hydrolase activity; 98, hydrolase activity, acting on acid anhydrides, involved in cellular and subcellular movement; 99, leucyl aminopeptidase activity; 100, metalloexopeptidase activity; 101, nucleic acid binding; 102, oxidoreductase activity; 103, peptidase activity; 104, RNA binding; 105, RNA dependent ATPase activity; 106, RNA helicase activity; 107, serine-type endopeptidase activity; 108, serine-type peptidase activity; 109, small protein conjugating enzyme activity; 110, structural constituent of chorion (sensu Insecta); 111, structural constituent of ribosome; 112, structural molecule activity; 113, thiolester hydrolase activity; 114, transporter activity; 115, trypsin activity; 116, ubiquitin conjugating enzyme activity.
Figure 7
Figure 7
Distribution of genes with high ovary-, testis-, and soma-biased expression in the genome. Gene positions are shown on the chromosome arms to scale with the positions of all genes on the five major chromosome arms (fourth and Y chromosomes not shown) presented as single tick marks for each in the upper column (All). The positions of genes represented by element species highly expressed in gonads and somatic tissues are presented in adjacent rows. The element species defined as highly expressed in the three tissue categories were up in multiple pairwise comparisons; ovary-biased (from microarrays versus both testis and female carcass), testis-biased (versus both ovary and male carcass) and somatic-biased (common among male carcass versus testis, and female carcass versus ovary). Asterisks indicate gene neighborhoods identified by Monte Carlo simulations with highly significant P values (*P < 10-3, **P < 10-4, ***P < 10-5).
Figure 8
Figure 8
Gene neighborhoods. Monte Carlo simulations (see Materials and methods) were used to identify statistically significant clusters of testis- and soma-biased genes using a series of window sizes ranging from five to 200 consecutive genes. Examples are shown for six gene neighborhoods that were found zero times in 100,000 replicated randomization tests. GADFLY [26] annotation images of the chromosomal regions for each neighborhood are shown with the genes identified by element species showing expression-bias, indicated by red boxes. The normalized intensities are shown below each neighborhood indicating high expression (yellow), moderate (red), low (blue) and below background (black). (a) A testis-biased cluster at cytological position 2L:35D4-F435, (b) a testis-biased cluster at 2R:50B1-50C6, (c) a testis-biased cluster at 2R:56E1-F9, (d) a testis-biased cluster at 2R: 59C3-D6, (e) a soma-biased cluster at 2R:47E1-F5 and (f) a soma-biased cluster at 2R:55C6-C8.

References

    1. Oliver B. Genetic control of germline sexual dimorphism in Drosophila. Int Rev Cytol. 2002;219:1–60. doi: 10.1016/S0074-7696(02)19010-3. - DOI - PubMed
    1. Cline TW. Two closely linked mutations in Drosophila melanogaster that are lethal to opposite sexes and interact with daughterless. Genetics. 1978;90:683–698. - PMC - PubMed
    1. McKeown M, Belote JM, Boggs RT. Ectopic expression of the female transformer gene product leads to female differentiation of chromosomally male Drosophila. Cell. 1988;53:887–895. - PubMed
    1. Belote JM, Baker BS. Sex determination in Drosophila melanogaster: analysis of transformer-2, a sex-transforming locus. Proc Natl Acad Sci USA. 1982;79:1568–1572. - PMC - PubMed
    1. Burtis KC, Baker BS. Drosophila doublesex gene controls somatic sexual differentiation by producing alternatively spliced mRNAs encoding related sex-specific polypeptides. Cell. 1989;56:997–1010. doi: 10.1016/0092-8674(89)90633-8. - DOI - PubMed

Publication types

LinkOut - more resources