

Cationic DMPC/DMTAP lipid bilayers: molecular dynamics study
- PMID: 15189847
- PMCID: PMC1304252
- DOI: 10.1529/biophysj.103.038760
Cationic DMPC/DMTAP lipid bilayers: molecular dynamics study
Abstract
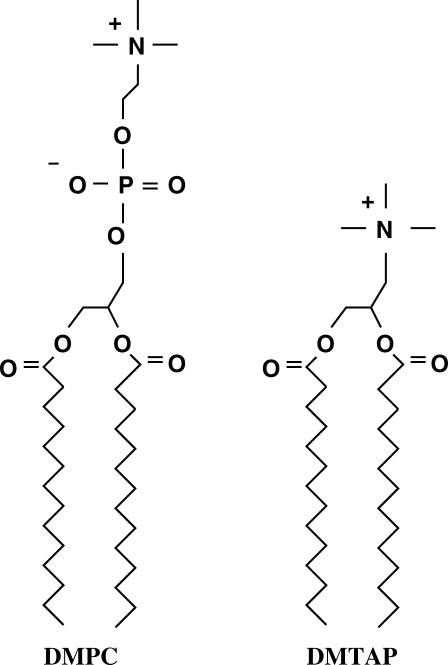
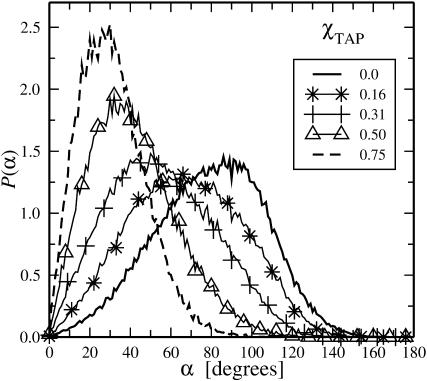
Cationic lipid membranes are known to form compact complexes with DNA and to be effective as gene delivery agents both in vitro and in vivo. Here we employ molecular dynamics simulations for a detailed atomistic study of lipid bilayers consisting of a mixture of cationic dimyristoyltrimethylammonium propane (DMTAP) and zwitterionic dimyristoylphosphatidylcholine (DMPC). Our main objective is to examine how the composition of the DMPC/DMTAP bilayers affects their structural and electrostatic properties in the liquid-crystalline phase. By varying the mole fraction of DMTAP, we have found that the area per lipid has a pronounced nonmonotonic dependence on the DMTAP concentration, with a minimum around the point of equimolar DMPC/DMTAP mixture. We show that this behavior has an electrostatic origin and is driven by the interplay between positively charged TAP headgroups and the zwitterionic phosphatidylcholine (PC) heads. This interplay leads to considerable reorientation of PC headgroups for an increasing DMTAP concentration, and gives rise to major changes in the electrostatic properties of the lipid bilayer, including a significant increase of total dipole potential across the bilayer and prominent changes in the ordering of water in the vicinity of the membrane. Moreover, chloride counterions are bound mostly to PC nitrogens implying stronger screening of PC heads by Cl ions compared to TAP headgroups. The implications of these findings are briefly discussed.
Figures


Similar articles
-
Cationic DMPC/DMTAP lipid bilayers: local lateral polarization of phosphatidylcholine headgroups.Langmuir. 2005 Jun 21;21(13):5677-80. doi: 10.1021/la046976x. Langmuir. 2005. PMID: 15952807
-
Effect of monovalent salt on cationic lipid membranes as revealed by molecular dynamics simulations.J Phys Chem B. 2005 Nov 10;109(44):21126-34. doi: 10.1021/jp053667m. J Phys Chem B. 2005. PMID: 16853736
-
Cationic dimyristoylphosphatidylcholine and dioleoyloxytrimethylammonium propane lipid bilayers: atomistic insight for structure and dynamics.J Phys Chem B. 2012 Jan 12;116(1):269-76. doi: 10.1021/jp210619q. Epub 2011 Dec 12. J Phys Chem B. 2012. PMID: 22117693
-
Ion dynamics in cationic lipid bilayer systems in saline solutions.J Phys Chem B. 2009 Jul 9;113(27):9226-34. doi: 10.1021/jp810233q. J Phys Chem B. 2009. PMID: 19534449
-
Shedding light on the structural properties of lipid bilayers using molecular dynamics simulation: a review study.RSC Adv. 2019 Feb 6;9(8):4644-4658. doi: 10.1039/c8ra08441f. eCollection 2019 Jan 30. RSC Adv. 2019. PMID: 35520151 Free PMC article. Review.
Cited by
-
Molecular simulation study of structural and dynamic properties of mixed DPPC/DPPE bilayers.Biophys J. 2006 Jun 1;90(11):3951-65. doi: 10.1529/biophysj.105.076596. Epub 2006 Mar 13. Biophys J. 2006. PMID: 16533838 Free PMC article.
-
An iris-like mechanism of pore dilation in the CorA magnesium transport system.Biophys J. 2010 Mar 3;98(5):784-92. doi: 10.1016/j.bpj.2009.11.009. Biophys J. 2010. PMID: 20197031 Free PMC article.
-
Cellular absorption of small molecules: free energy landscapes of melatonin binding at phospholipid membranes.Sci Rep. 2020 Jun 8;10(1):9235. doi: 10.1038/s41598-020-65753-z. Sci Rep. 2020. PMID: 32513935 Free PMC article.
-
Atomic-scale structure and electrostatics of anionic palmitoyloleoylphosphatidylglycerol lipid bilayers with Na+ counterions.Biophys J. 2007 Feb 15;92(4):1114-24. doi: 10.1529/biophysj.106.086272. Epub 2006 Nov 17. Biophys J. 2007. PMID: 17114222 Free PMC article.
-
Properties of mixed cationic membranes studied by fluorescence solvent relaxation.J Fluoresc. 2008 Sep;18(5):925-8. doi: 10.1007/s10895-008-0321-6. Epub 2008 Feb 7. J Fluoresc. 2008. PMID: 18256909
References
-
- Anderson, W. F. 1998. Human gene therapy. Nature. 392(Suppl.):25–30. - PubMed
-
- Anézo, C., A. H. de Vries, H. D. Höltje, D. P. Tieleman, and S. J. Marrink. 2003. Methodological issues in lipid bilayer simulations. J. Phys. Chem. B. 107:9424–9433.
-
- Artzner, F., R. Zantl, G. Rapp, and J. O. Rädler. 1998. Observation of a rectangular columnar phase in condensed lamellar cationic lipid-DNA complexes. Phys. Rev. Lett. 81:5015–5018.
-
- Astafieva, I., I. Maksimova, E. Lukanidin, V. Alakhov, and A. Kabanov. 1996. Enhancement of the polycation-mediated DNA uptake and cell transfection with pluronic P85 block copolymer. FEBS Lett. 389:278–280. - PubMed
-
- Bandyopadhyay, S., M. Tarek, and M. L. Klein. 1999. Molecular dynamics study of a lipid-DNA complex. J. Phys. Chem. B. 103:10075–10080.
Publication types
MeSH terms
Substances
LinkOut - more resources
Full Text Sources
Other Literature Sources
Miscellaneous
