

Computational simulations of interactions of scorpion toxins with the voltage-gated potassium ion channel
- PMID: 15189853
- PMCID: PMC1304258
- DOI: 10.1529/biophysj.103.039461
Computational simulations of interactions of scorpion toxins with the voltage-gated potassium ion channel
Abstract
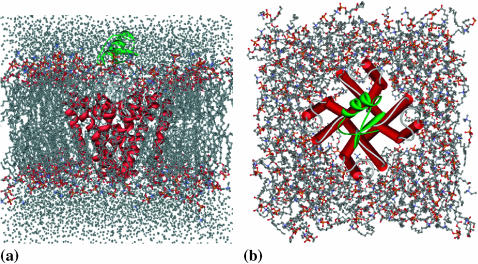
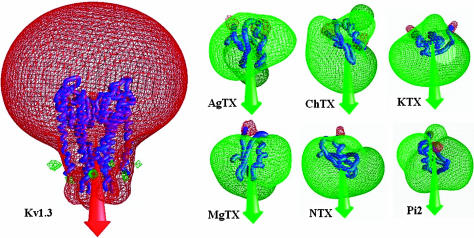
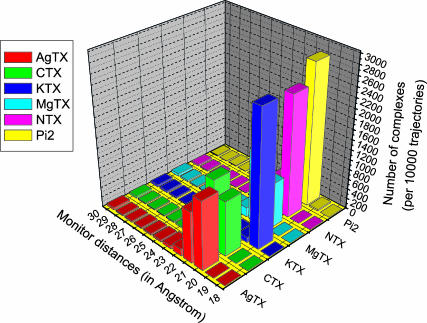
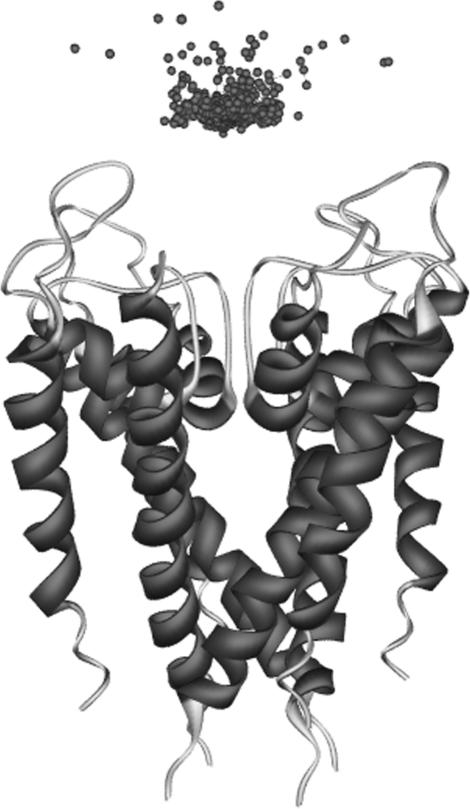
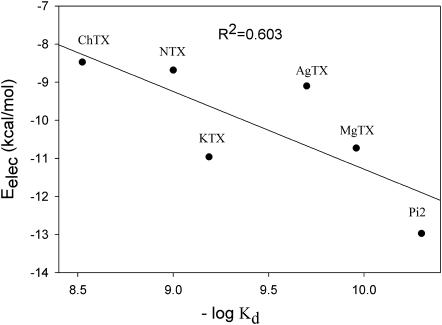
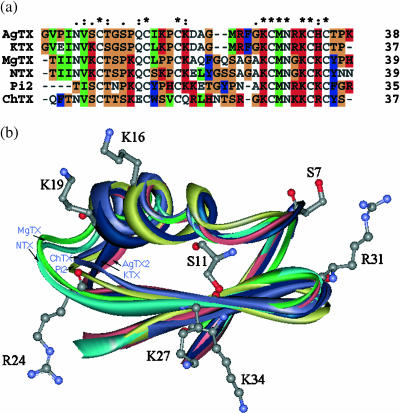
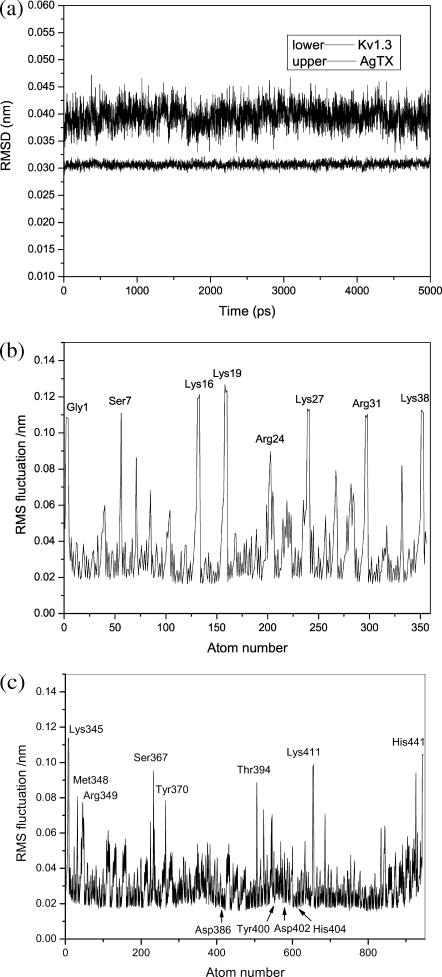
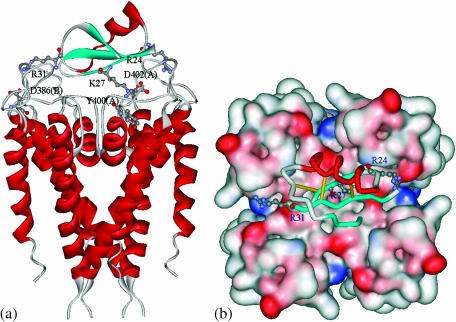
Based on a homology model of the Kv1.3 potassium channel, the recognitions of the six scorpion toxins, viz. agitoxin2, charybdotoxin, kaliotoxin, margatoxin, noxiustoxin, and Pandinus toxin, to the human Kv1.3 potassium channel have been investigated by using an approach of the Brownian dynamics (BD) simulation integrating molecular dynamics (MD) simulation. Reasonable three-dimensional structures of the toxin-channel complexes have been obtained employing BD simulations and triplet contact analyses. All of the available structures of the six scorpion toxins in the Research Collaboratory for Structural Bioinformatics Protein Data Bank determined by NMR were considered during the simulation, which indicated that the conformations of the toxin significantly affect both the molecular recognition and binding energy between the two proteins. BD simulations predicted that all the six scorpion toxins in this study use their beta-sheets to bind to the extracellular entryway of the Kv1.3 channel, which is in line with the primary clues from the electrostatic interaction calculations and mutagenesis results. Additionally, the electrostatic interaction energies between the toxins and Kv1.3 channel correlate well with the binding affinities (-logK(d)s), R(2) = 0.603, suggesting that the electrostatic interaction is a dominant component for toxin-channel binding specificity. Most importantly, recognition residues and interaction contacts for the binding were identified. Lys-27 or Lys-28, residues Arg-24 or Arg-25 in the separate six toxins, and residues Tyr-400, Asp-402, His-404, Asp-386, and Gly-380 in each subunit of the Kv1.3 potassium channel, are the key residues for the toxin-channel recognitions. This is in agreement with the mutation results. MD simulations lasting 5 ns for the individual proteins and the toxin-channel complexes in a solvated lipid bilayer environment confirmed that the toxins are flexible and the channel is not flexible in the binding. The consistency between the results of the simulations and the experimental data indicated that our three-dimensional models of the toxin-channel complex are reasonable and can be used as a guide for future biological studies, such as the rational design of the blocking agents of the Kv1.3 channel and mutagenesis in both toxins and the Kv1.3 channel. Moreover, the simulation result demonstrates that the electrostatic interaction energies combined with the distribution frequencies from BD simulations might be used as criteria in ranking the binding configuration of a scorpion toxin to the Kv1.3 channel.
Figures

Similar articles
-
Brownian dynamics simulations of the recognition of the scorpion toxin maurotoxin with the voltage-gated potassium ion channels.Biophys J. 2002 Nov;83(5):2370-85. doi: 10.1016/S0006-3495(02)75251-X. Biophys J. 2002. PMID: 12414674 Free PMC article.
-
Brownian dynamics simulations of the recognition of the scorpion toxin P05 with the small-conductance calcium-activated potassium channels.J Mol Biol. 2002 Apr 26;318(2):417-28. doi: 10.1016/S0022-2836(02)00095-5. J Mol Biol. 2002. PMID: 12051848
-
Brownian dynamics simulations of interaction between scorpion toxin Lq2 and potassium ion channel.Biophys J. 2001 Apr;80(4):1659-69. doi: 10.1016/S0006-3495(01)76138-3. Biophys J. 2001. PMID: 11259281 Free PMC article.
-
Unique interaction of scorpion toxins with the hERG channel.J Mol Recognit. 2004 May-Jun;17(3):209-17. doi: 10.1002/jmr.667. J Mol Recognit. 2004. PMID: 15137031 Review.
-
Contribution of the functional dyad of animal toxins acting on voltage-gated Kv1-type channels.J Pept Sci. 2005 Feb;11(2):65-8. doi: 10.1002/psc.630. J Pept Sci. 2005. PMID: 15635666 Review.
Cited by
-
Permeation and block of the Kv1.2 channel examined using brownian and molecular dynamics.Biophys J. 2011 Dec 7;101(11):2671-8. doi: 10.1016/j.bpj.2011.10.045. Biophys J. 2011. PMID: 22261055 Free PMC article.
-
Computational methods of studying the binding of toxins from venomous animals to biological ion channels: theory and applications.Physiol Rev. 2013 Apr;93(2):767-802. doi: 10.1152/physrev.00035.2012. Physiol Rev. 2013. PMID: 23589832 Free PMC article. Review.
-
Scorpion toxins prefer salt solutions.J Mol Model. 2015 Nov;21(11):287. doi: 10.1007/s00894-015-2822-y. Epub 2015 Oct 16. J Mol Model. 2015. PMID: 26475740
-
Complexes of Peptide Blockers with Kv1.6 Pore Domain: Molecular Modeling and Studies with KcsA-Kv1.6 Channel.J Neuroimmune Pharmacol. 2017 Jun;12(2):260-276. doi: 10.1007/s11481-016-9710-9. Epub 2016 Sep 17. J Neuroimmune Pharmacol. 2017. PMID: 27640211
-
Solution structure of PcFK1, a spider peptide active against Plasmodium falciparum.Protein Sci. 2006 Mar;15(3):628-34. doi: 10.1110/ps.051860606. Epub 2006 Feb 1. Protein Sci. 2006. PMID: 16452619 Free PMC article.
References
-
- Aiyar, J., J. P. Rizzi, G. A. Gutman, and K. G. Chandy. 1996. The signature sequence of voltage-gated potassium channels projects into the external vestibule. J. Biol. Chem. 271:31013–31016. - PubMed
-
- Alessandri-Haber, N., A. Lecoq, S. Gasparini, G. Grangier-Macmath, G. Jacquet, A. L. Harveyi, C. de Medeirosi, E. G. Rowani, M. Gola, A. Menez, and M. Crest. 1999. Mapping the functional anatomy of BgK on Kv1.1, Kv1.2, and Kv1.3. J. Biol. Chem. 274:35653–35661. - PubMed
-
- Beeton, C., J. Barbaria, P. Giraud, J. Devaux, A.-M. Benoliel, M. Gola, J. M. Sabatier, D. Bernard, M. Crest, and E. Beraud. 2001. Selective blocking of voltage-gated K+ channels improves experimental autoimmune encephalomyelitis and inhibits T cell activation. J. Immunol. 166:936–944. - PubMed
-
- Berendsen, H. J. C., D. van der Spoel, and R. van Drunen. 1995. GROMACS: a message-passing parallel molecular dynamics implementation. Comp. Phys. Commun. 91:43–56.
-
- Biggin, P. C., T. Roosild, and S. Choe. 2000. Potassium channel structure: domain by domain. Curr. Opin. Struct. Biol. 10:456–461. - PubMed
Publication types
MeSH terms
Substances
LinkOut - more resources
Full Text Sources
Miscellaneous
