. 2004 Jun;86(6):3700-8.
doi: 10.1529/biophysj.103.032508.

Cholera toxin assault on lipid monolayers containing ganglioside GM1

Affiliations

Cholera toxin assault on lipid monolayers containing ganglioside GM1

C E Miller et al. Biophys J. 2004 Jun.

Abstract

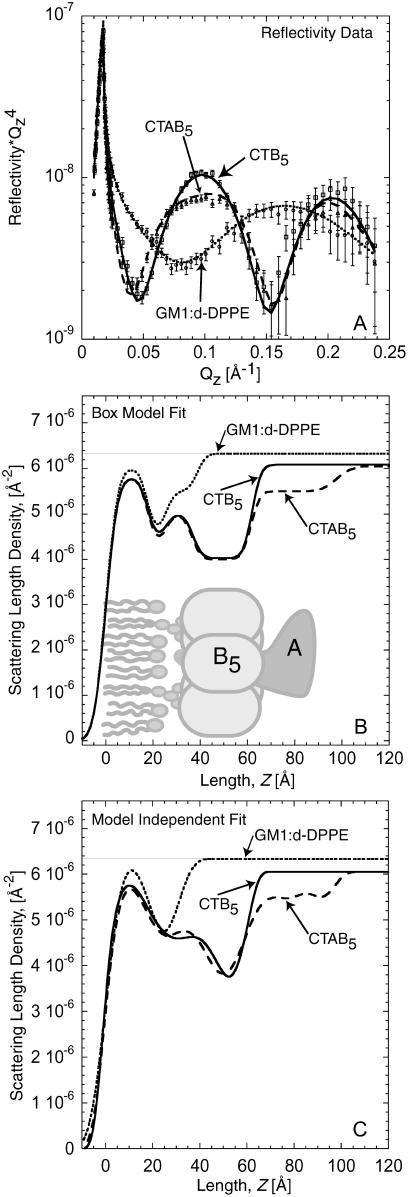
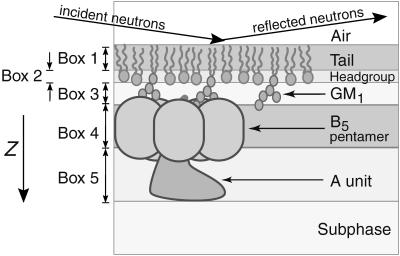
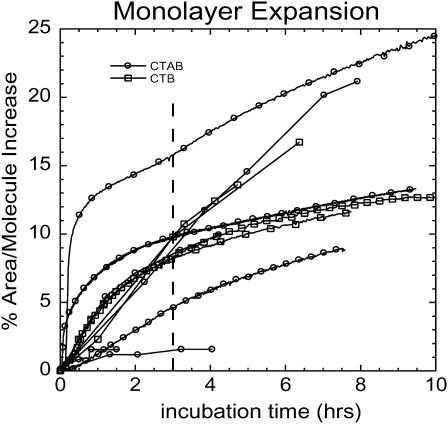
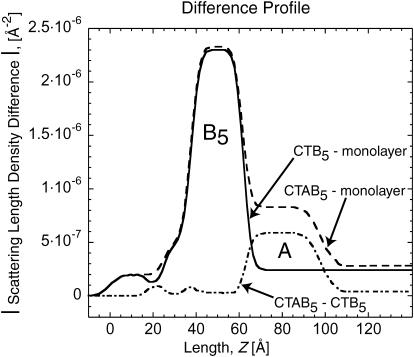
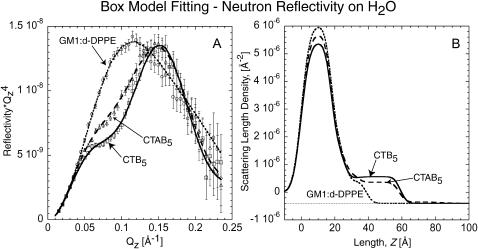
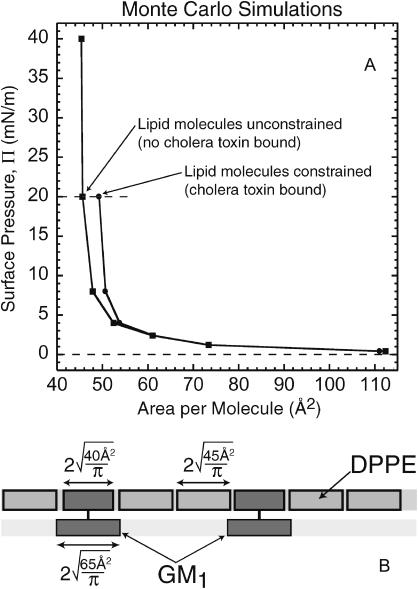
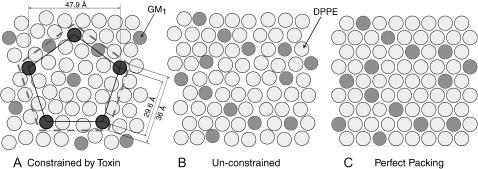
Many bacterial toxins bind to and gain entrance to target cells through specific interactions with membrane components. Using neutron reflectivity, we have characterized the structure of mixed DPPE:GM(1) lipid monolayers before and during the binding of cholera toxin (CTAB(5)) or its B-subunit (CTB(5)). Structural parameters such as the density and thickness of the lipid layer, extension of the GM(1) oligosaccharide headgroup, and orientation and position of the protein upon binding are reported. The density of the lipid layer was found to decrease slightly upon protein binding. However, the A-subunit of the whole toxin is clearly located below the B-pentameric ring, away from the monolayer, and does not penetrate into the lipid layer before enzymatic cleavage. Using Monte Carlo simulations, the observed monolayer expansion was found to be consistent with geometrical constraints imposed on DPPE by multivalent binding of GM(1) by the toxin. Our findings suggest that the mechanism of membrane translocation by the protein may be aided by alterations in lipid packing.


Figures

FIGURE 1
FIGURE 1
(A) Neutron reflectivity of the monolayer, monolayer with bound CTB5, and monolayer with bound CTAB5. Points with error bars are measured data. Solid and dashed lines indicate fits to the data corresponding to the scattering length density profile in B. (B) Scattering length density profile of box model fits shown in A. A detailed schematic of the box model is provided in Fig. 2. In the profile for the monolayer, the lipid tail, head, and saccharide regions are clearly distinguishable. When CTB5 and CTAB5 are bound, the structure of the lipid monolayer is not significantly altered. The decrease in scattering length density (β(z)) of the lipid tail and headgroup regions is due to an increase in the area per molecule consistent with geometrical constraints applied when cholera toxin binds GM1. The A-subunit clearly resides below the B5 pentamer, facing away from the lipid layer. (C) β(z) profile from the cubic β-spline fitting routine. Reflectivity fits are not shown in A for clarity, but were slightly better than the box model fits. The β(z) profiles from both fitting methods are very similar, suggesting that the real-space structure from the box model fits is reasonable. Note: The difference in the β(z) of the subphase is due to the small addition of H2O used for solvating the protein before incubation with the monolayer.
FIGURE 2
FIGURE 2
Illustration of the lipid-protein system and box model representation. Boxes 1–3 were used to represent the d-DPPE:GM1 lipid monolayer. Boxes 4 and 5 were added in subsequent experiments to account for the B5 pentamer of CTB5 and the A-subunit of CTAB5.
FIGURE 3
FIGURE 3
Area expansion curves of the GM1-DPPE monolayer after CTAB5 or CTB5 has been added. There are variations in the % area expansion between experiments. The 8 ± 5% expansion reported is a result of 11 independent experiments for CTAB5 and CTB5 after 3 h of incubation (indicated by a dashed line). There error of ±5% refers to the standard deviation of the values at 3 h of incubation. There is no trend showing more expansion for CTAB5 or CTB5.
FIGURE 4
FIGURE 4
Scattering length density difference profile of NR measurements done on D2O buffer subphase. In the CTB5-monolayer case, the B5 unit can be seen along with differences in the lipid region. In the CTAB5-CTB5 case, the A-unit can clearly be seen to be oriented away from the lipid layer. There is little-to-no change in the lipid region when CTB5 and CTAB5 are bound implying that there is little to no A-unit penetration before activation.
FIGURE 5
FIGURE 5
Neutron reflectivity with H2O as the subphase instead of D2O. (A) Neutron reflectivity of the monolayer, monolayer with bound CTB5, and monolayer with bound CTAB5. Solid and dashed lines indicate the fit corresponding to the profile in B. Points with error bars correspond to measured data. (B) Scattering length density profile of fits shown in A obtained by box model fitting methods. The same features of lipid tails, lipid heads, and the B5 subunit can be seen. The A-unit of CTAB5 is not very visible due to small contrast between the scattering length density of H2O and the A-unit layer. These results are consistent with that of NR done on D2O. The difference in β(z) of the lipid tail region for bound CTAB5 and CTB5 is most likely due to different protein coverage. The increased amount on CTB5 coverage (indicated by a larger β(z) for Box 4) is responsible for a larger decrease in lipid tail β(z) due to a larger increase in area per molecule of the lipid layer.
FIGURE 6
FIGURE 6
To assess the effects of binding time, five consecutive scans on CTAB5 with D2O subphase were performed. The scans were done after 3, 6.5, 9.5, 13, and 16.5 h of incubation. The reflectivity profiles are essentially identical for each scan.
FIGURE 7
FIGURE 7
(A) Π-A isotherm generated from computer simulations. The area per molecule increases by 7% at 20 mN/m due to lipid packing inefficiencies imposed by the pentagonal fixing of GM1 lipids when CTB5 or CTAB5 bind. The surface pressures of the simulations have been rescaled to match results obtained from experimental isotherms of a monolayer with no bound toxin. This figure shows an illustration demonstrating lipid packing under constrained and unconstrained conditions. (B) Description of the two-dimensional coupled Monte Carlo simulation model used for mixed DPPE:GM1 monolayers.
FIGURE 8
FIGURE 8
Lipid packing arrangements generated from Monte Carlo simulations (see also Fig. 7). GM1 molecules are represented by dark disks with an area of 40 Å2 and DPPE (lighter disks) molecules with an area of 45 Å2 (Majewski et al., 2001). (A) Simulation result: When CTB5 binds, it constrains up to five GM1 molecules (shown darker that other GM1 molecules) at protein binding site locations. The corners of the inner pentagon represent these binding sites. The larger dashed pentagon represents the area of one toxin molecule. When 55 out of 200 GM1 lipids are fixed by protein binding (∼50% coverage) the result is a 7% decrease in lipid packing density (see text for further details). This decrease in lipid packing density is consistent with the observed monolayer area expansion at a constant surface pressure of 20 mN/m. (B) Simulation result: Shows an 80:20 DPPE:GM1 monolayer at 20 mN/m in the absence of protein binding (no constraints). (C) Shows perfect packing of the monolayer for reference.

References

    1. Braslau, A., P. S. Pershan, G. Swislow, B. M. Ocko, and J. Als-Nielsen. 1988. Capillary waves on the surface of simple liquids measured by x-ray reflectivity. Phys. Rev. A. 38:2457–2470. - PubMed
    1. Faller, R., and J. J. de Pablo. 2002. Constant pressure hybrid molecular dynamics-Monte Carlo simulations. J. Chem. Phys. 116:55–59.
    1. Faller, R., and J. J. de Pablo. 2003. Density of states of a binary Lennard-Jones glass. J. Chem. Phys. 119:4405–4408.
    1. Faller, R., and T. L. Kuhl. 2003. Modeling the binding of cholera-toxin to a lipid membrane by a nonadditive two-dimensional hard disk model. Soft Mat. 1:343–352.
    1. Grigera, T. S., and G. Parisi. 2001. Fast Monte Carlo algorithm for supercooled soft spheres. Art. no. 045102. Phys. Rev. E. 6304:5102. - PubMed

Publication types

LinkOut - more resources