Structure of supported bilayers composed of lipopolysaccharides and bacterial phospholipids: raft formation and implications for bacterial resistance
- PMID: 15189872
- PMCID: PMC1304277
- DOI: 10.1529/biophysj.103.037507
Structure of supported bilayers composed of lipopolysaccharides and bacterial phospholipids: raft formation and implications for bacterial resistance
Abstract
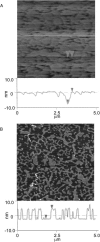
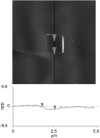
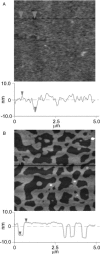
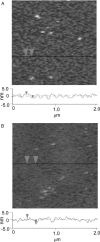
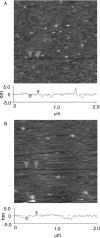
Lipopolysaccharide (LPS), the major lipid on the surface of Gram-negative bacteria, plays a key role in bacterial resistance to hydrophobic antibiotics and antimicrobial peptides. Using atomic force microscopy (AFM) we characterized supported bilayers composed of LPSs from two bacterial chemotypes with different sensitivities to such antibiotics and peptides. Rd LPS, from more sensitive "deep rough" mutants, contains only an inner saccharide core, whereas Ra LPS, from "rough" mutants, contains a longer polysaccharide region. A vesicle fusion technique was used to deposit LPS onto either freshly cleaved mica or polyethylenimine-coated mica substrates. The thickness of the supported bilayers measured with contact-mode AFM was 7 nm for Rd LPS and 9 nm for Ra LPS, consistent with previous x-ray diffraction measurements. In water the Ra LPS bilayer surface was more disordered than Rd LPS bilayers, likely due to the greater volume occupied by the longer Ra LPS polysaccharide region. Since deep rough mutants contain bacterial phospholipid (BPL) as well as LPS on their surfaces, we also investigated the organization of Rd LPS/BPL bilayers. Differential scanning calorimetry and x-ray diffraction indicated that incorporation of BPL reduced the phase transition temperature, enthalpy, and average bilayer thickness of Rd LPS. For Rd LPS/BPL mixtures, AFM showed irregularly shaped regions thinner than Rd LPS bilayers by 2 nm (the difference in thickness between Rd LPS and BPL bilayers), whose area increased with increasing BPL concentration. We argue that the increased permeability of deep rough mutants is due to structural modifications caused by BPL to the LPS membrane, in LPS hydrocarbon chain packing and in the formation of BPL-enriched microdomains.
Figures




Similar articles
-
The lipopolysaccharide barrier: correlation of antibiotic susceptibility with antibiotic permeability and fluorescent probe binding kinetics.Biochemistry. 2000 Sep 26;39(38):11777-87. doi: 10.1021/bi000810n. Biochemistry. 2000. PMID: 10995246
-
Lipopolysaccharides in bacterial membranes act like cholesterol in eukaryotic plasma membranes in providing protection against melittin-induced bilayer lysis.Biochemistry. 2003 Feb 4;42(4):1101-8. doi: 10.1021/bi026932s. Biochemistry. 2003. PMID: 12549932
-
Charge and aggregation pattern govern the interaction of plasticins with LPS monolayers mimicking the external leaflet of the outer membrane of Gram-negative bacteria.Biochim Biophys Acta. 2015 Nov;1848(11 Pt A):2967-79. doi: 10.1016/j.bbamem.2015.09.005. Epub 2015 Sep 4. Biochim Biophys Acta. 2015. PMID: 26343162
-
Morphological and nanostructural surface changes in Escherichia coli over time, monitored by atomic force microscopy.Colloids Surf B Biointerfaces. 2016 May 1;141:355-364. doi: 10.1016/j.colsurfb.2016.02.006. Epub 2016 Feb 6. Colloids Surf B Biointerfaces. 2016. PMID: 26878286 Review.
-
Lipid domains in supported lipid bilayer for atomic force microscopy.Methods Mol Biol. 2007;400:503-13. doi: 10.1007/978-1-59745-519-0_34. Methods Mol Biol. 2007. PMID: 17951756 Review.
Cited by
-
Cholesterol in negatively charged lipid bilayers modulates the effect of the antimicrobial protein granulysin.J Membr Biol. 2006;212(1):29-39. doi: 10.1007/s00232-006-0040-3. Epub 2007 Jan 6. J Membr Biol. 2006. PMID: 17206515
-
Bucking the trend: understanding lipopolysaccharide structure and outer membrane dynamics in cold-adapted Pseudomonas isolated from Enigma Lake, Antarctica.Chem Sci. 2024 Sep 18;15(43):17852-61. doi: 10.1039/d4sc05116e. Online ahead of print. Chem Sci. 2024. PMID: 39328195 Free PMC article.
-
Exploring the Molecular Dynamics of a Lipid-A Vesicle at the Atom Level: Morphology and Permeation Mechanism.J Phys Chem B. 2023 Aug 3;127(30):6694-6702. doi: 10.1021/acs.jpcb.3c02848. Epub 2023 Jul 19. J Phys Chem B. 2023. PMID: 37467380 Free PMC article.
-
Photocatalytic Degradation of Bacterial Lipopolysaccharides by Peptide-Coated TiO2 Nanoparticles.ACS Appl Mater Interfaces. 2024 Nov 6;16(44):60056-60069. doi: 10.1021/acsami.4c15706. Epub 2024 Oct 23. ACS Appl Mater Interfaces. 2024. PMID: 39443826 Free PMC article.
-
A Molecularly Complete Planar Bacterial Outer Membrane Platform.Sci Rep. 2016 Sep 7;6:32715. doi: 10.1038/srep32715. Sci Rep. 2016. PMID: 27600663 Free PMC article.
References
-
- Abu-Lail, N. I., and T. A. Camesano. 2003. Role of lipopolysaccharides in the adhesion, retention, and transport of Escherichia coli JM109. Environ. Sci. Technol. 37:2173–2183. - PubMed
-
- Allende, D., and T. J. McIntosh. 2003. Lipopolysaccharides in bacterial membranes act like cholesterol in eukaryotic membranes in providing protection against melittin-induced bilayer lysis. Biochemistry. 42:1101–1108. - PubMed
-
- Amro, N. A., L. P. Kotra, K. Wadu-Mesthrige, A. Bulychev, S. Mobashery, and G. Liu. 2000. High-resolution atomic force microscopy studies of the Escherichia coli outer membrane: structural basis for permeability. Langmuir. 16:2789–2796.
-
- Baumgart, T., S. T. Hess, and W. W. Webb. 2003. Imaging coexisting fluid domains in biomembrane models coupling curvature and line tension. Nature. 425:821–824. - PubMed
Publication types
MeSH terms
Substances
Grants and funding
LinkOut - more resources
Full Text Sources
Miscellaneous

