. 2004 Jun;86(6):4075-93.
doi: 10.1529/biophysj.103.035717.

Ultrafine membrane compartments for molecular diffusion as revealed by single molecule techniques

Affiliations

Ultrafine membrane compartments for molecular diffusion as revealed by single molecule techniques

Kotono Murase et al. Biophys J. 2004 Jun.

Abstract

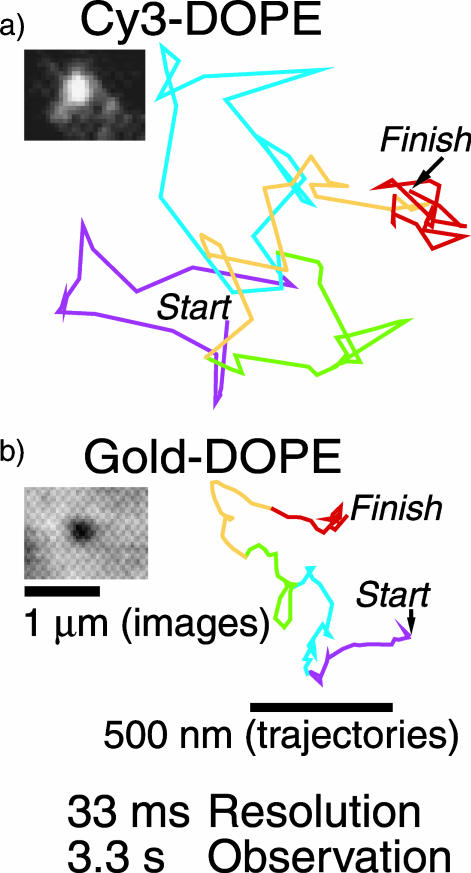
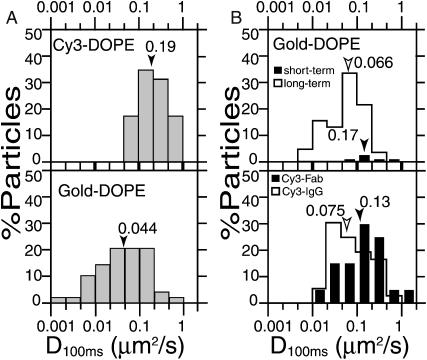
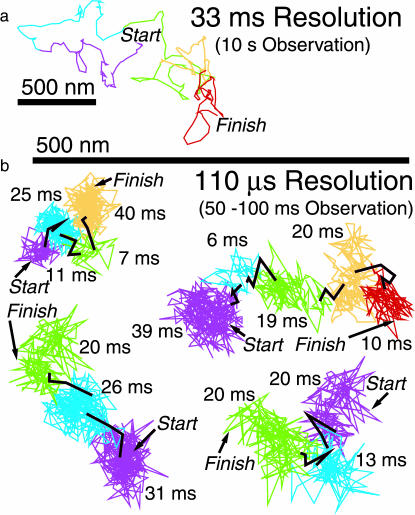
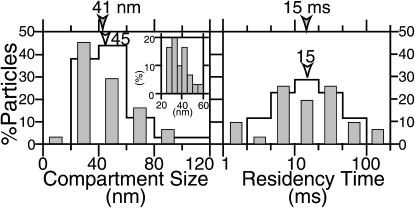
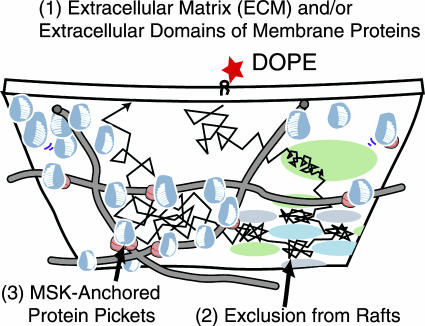
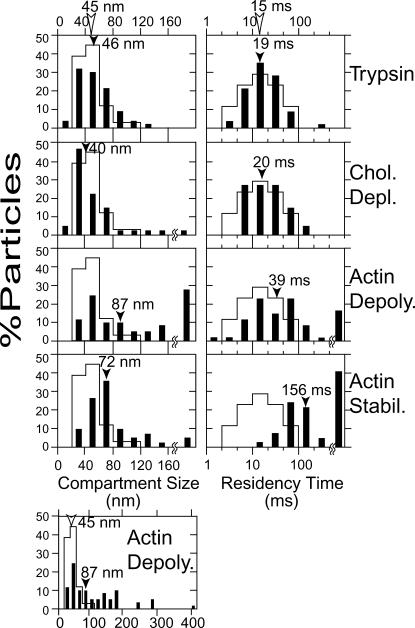
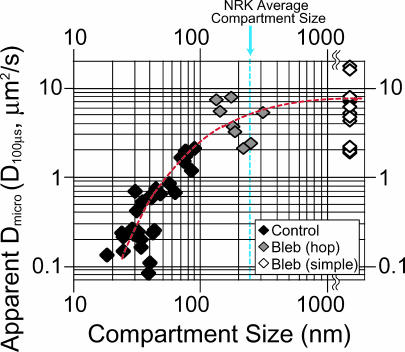
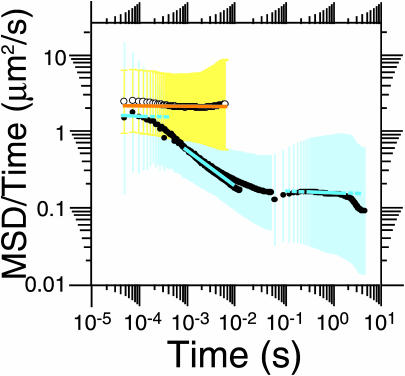
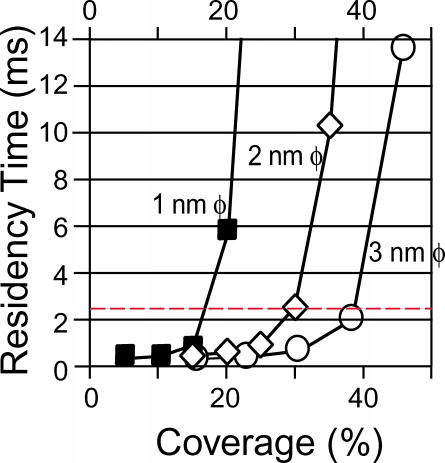
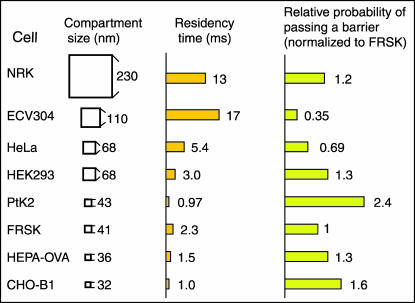
Plasma membrane compartments, delimited by transmembrane proteins anchored to the membrane skeleton (anchored-protein picket model), would provide the membrane with fundamental mosaicism because they would affect the movement of practically all molecules incorporated in the cell membrane. Understanding such basic compartmentalized structures of the cell membrane is critical for further studies of a variety of membrane functions. Here, using both high temporal-resolution single particle tracking and single fluorescent molecule video imaging of an unsaturated phospholipid, DOPE, we found that plasma membrane compartments generally exist in various cell types, including CHO, HEPA-OVA, PtK2, FRSK, HEK293, HeLa, T24 (ECV304), and NRK cells. The compartment size varies from 30 to 230 nm, whereas the average hop rate of DOPE crossing the boundaries between two adjacent compartments ranges between 1 and 17 ms. The probability of passing a compartment barrier when DOPE is already at the boundary is also cell-type dependent, with an overall variation by a factor of approximately 7. These results strongly indicate the necessity for the paradigm shift of the concept on the plasma membrane: from the two-dimensional fluid continuum model to the compartmentalized membrane model in which its constituent molecules undergo hop diffusion over the compartments.


Figures

FIGURE 1
FIGURE 1
Typical images and trajectories of Cy3- and Gold-DOPE recorded at a 33-ms resolution (video rate) for 3.3 s (100 frames). (a) SFVI of Cy3-DOPE. (b) SPT of Gold-DOPE (gold probes coated with anti-fluorescein antibody Fab fragments bound to fluorescein-DOPE, which was preincorporated in the cell membrane). The colors (purple, blue, green, orange, and red) represent the trajectories over time periods of 20 steps (every 660 ms). The color sequence is consistent throughout this article. The actual video images are also shown.
FIGURE 2
FIGURE 2
Distribution of diffusion coefficients in a 100-ms time-window (D100ms). D100ms is the same as D2–4 in Kusumi et al. (1993). Arrowheads indicate the median values. (A) D100ms estimated for Cy3- (top) and Gold-DOPE observed using our standard observation protocol (bottom), which involves the observation of all of the gold particles attached to the membrane longer than 3 s, but the observation is limited for 20 min after the addition of the gold probes. (B) (Top) D100ms for Gold-DOPE estimated for particles bound to the membrane surface for shorter periods (between 3 and 150 s, the short-term reporters, solid bars) and for those bound for longer periods (5 min or longer, the long-term reporters, open bars), indicating that those bound to the membrane for short periods exhibit diffusion coefficients comparable to Cy3-DOPE. See the text for details. Note that for the determination of the long-term reporters, we only observed for 5 min, and did not examine how much longer than 5 min they stayed on the membrane surface, whereas the observation following the standard protocol would include the short-term reporters as well as the gold probes that might have stayed much longer than 20 min, and therefore, its D100ms distribution becomes broader than that for the short-term reporters and the long-term reporters combined. (Bottom) Fab fragments and the whole IgG of anti-fluorescein antibodies were labeled with Cy3, and their diffusion coefficients after binding to fluorescein-DOPE were measured. D100ms estimated for Cy3-Fab-DOPE (solid bars) and Cy3-IgG-DOPE (open bars).
FIGURE 3
FIGURE 3
Gold-DOPE observed at a 110-μs resolution exhibited hop diffusion. What appears to be simple Brownian diffusion at a 33-ms resolution (a, video rate) is actually fast hop diffusion, as visible in recordings at a 110-μs resolution (b, 300-fold faster than the video rate). (a) Each color represents 60 step periods (every 2 s). (b) Each color indicates plausible confinement within a compartment, and black indicates intercompartmental hops. The residency time for each compartment is indicated. These compartments were detected by computer software we developed (Fujiwara et al., 2002) as well as by eye.
FIGURE 4
FIGURE 4
Distributions of the compartment size (left) and the residency time (right) for Gold-DOPE indicate the presence of 41-nm compartments (median observed at a 25-μs resolution) and 15-ms residency time (median) in a compartment. Open bars and solid bars indicate the distributions observed at 110-μs and 25-μs resolutions, respectively. Arrowheads indicate the median values. The inset in the histogram for the compartment size shows more detailed distributions (25-μs resolution data).
FIGURE 5
FIGURE 5
Models for the mechanisms that could be responsible for the temporal corralling and hop diffusion of DOPE.
FIGURE 6
FIGURE 6
The extracellular matrices and the extracellular domains of the membrane proteins are partially cleaved by treatment of cells with trypsin. (A) (a, b) After the amino groups of the cell surface proteins were first tagged with biotin, the cells were incubated with 10 μg/ml trypsin (or trypsin-free medium) for 10 min and then visualized with FITC-streptavidin (biotin labeling after trypsin treatment gave nearly the same results): a, no treatment; b, after trypsin treatment. The focus of the microscope is on the lamellipodia, where most SPT experiments were carried out. (c, d) The amount of remaining chondroitin sulfate glycosaminoglycan was quantitated by immunofluorescence staining before (c) and after (d) trypsin treatment. (B) Fluorescence intensity due to the remaining cell surface proteins and chondroitin sulfate after trypsin treatment (10 min), plotted as a function of trypsin concentration. The fluorescence intensity (70 × 70 pixels ≈ 8 × 8 μm) was normalized to that before trypsin treatment. The background was determined as the intensity in the area on the cover glass where no cell was attached, and was subtracted from the measured intensity in each area on the cell. A total of 40 cells were used for the measurements, with a total measured area of ∼3000 μm2.
FIGURE 7
FIGURE 7
Histograms showing the distributions of the compartment size (left) and the residency time (right) after various treatments (solid bars). Observations were carried out at a 110-μs resolution for a period of 278 ms for each trajectory. The compartment size and the residency time were determined as described in the legend to Table 4. From top to bottom, trypsin treatment (10 μg/ml, 10 min, 68 particles), partial depletion of cholesterol by MβCD (4 mM, 20 min, 51 particles), partial depolymerization of f-actin by cytochalasin D (13 μM, 5–15 min, 68 particles), and stabilization of f-actin by jasplakinolide (0.5 μM, 5–15 min, 45 particles). In the bottom left corner, the distribution of the compartment size after cytochalasin D treatment is shown in a broader range. Arrowheads indicate median values. Open bars indicate the distributions before treatment (control, same as those in Fig. 4), and reflect the collective control results (before treatment) for all treatments.
FIGURE 8
FIGURE 8
Apparent Dmicro (in a time-window of 100 μs based on 25-μs resolution observations) plotted against compartment size, as determined for each trajectory in the control and bleb membranes. With a larger compartment size, the apparent Dmicro increased, suggesting that in smaller compartments, even a 25-μs resolution is insufficient to obtain true diffusion rates. This figure is generated using the same data set used to generate Fig. 4 (at a 25-μs resolution, solid bars) and the bleb data obtained at a 25-μs resolution. The average compartment size for NRK cells is indicated (dashed blue line). The dashed red line is a visual aid.
FIGURE 9
FIGURE 9
Plots of log(MSD/time) against log(time) provide useful information on the changes of the diffusion characteristics that depend on the observation time intervals. MSD of the trajectories was estimated using data obtained at time resolutions of 25 μs (5000 frames long), 110 μs (5000 frames long), and 33 ms (500 frames long), for the time-windows where the theoretically expected statistical errors in MSD are <40% (Qian et al., 1991). Then, the mean log(MSD/time) values (•) and their standard deviations (blue and yellow vertical bars, which may look like a band due to the high density of the data points here) were plotted as a function of log(time). Normal (simple Brownian) and anomalous diffusion can be distinguished in this display as lacking time-dependence (slope ∼ 0) and having negative slopes, respectively (Saxton, 1994; Feder et al., 1996). The best fit for the data obtained for the cell membrane using the three linear segments, depicted by blue lines, with α-values of 0.97 (50 μs ∼ 0.13 ms), 0.53 (1 ∼ 10 ms), and 0.94 (300 ms ∼ 2 s) gives transitions at ∼0.1 ms (or less) and between 10 and 100 ms. (Fitted regions are shown in solid lines. To help the eye, they are extended, which are shown in broken lines. The fit between 1 and 10 ms appears bad, but in fact there are many more points in the lower black sequence of •; i.e., the fit was done correctly.) For comparison, the plots for the trajectories in bleb membranes (○ = 1000 frames; n = 24) and the best regression result (orange line, α = ∼1.0) are also shown.
FIGURE 10
FIGURE 10
Two-dimensional, Brownian dynamics/Monte Carlo simulations indicate that ∼17% coverage of the boundary with 1-nm-φ transmembrane anchored proteins is sufficient to reproduce the experimentally determined hop rate of 2.3 ms on average. The average residency time of Monte Carlo particles in a 40-nm compartment is plotted against percent of coverage of each side of the square compartment. The red broken line indicates the experimentally determined residency time (2.3 ms). The results indicate that seven 1-nm proteins (∼17% coverage), six 2-nm proteins (∼30% coverage), or five 3-nm proteins (∼38% coverage), located along each side of the square compartment, were needed to reproduce the experimental residency time values of 2.3 ms.
FIGURE 11
FIGURE 11
Summary of the hop diffusion parameters observed in various cell types.

References

    1. Almeida, P. F., W. L. Vaz, and T. E. Thompson. 1992. Lateral diffusion and percolation in two-phase, two-component lipid bilayers. Topology of the solid-phase domains in-plane and across the lipid bilayer. Biochemistry. 31:7198–7210. - PubMed
    1. Bubb, M. R., I. Spector, B. B. Beyer, and K. M. Fosen. 2000. Effects of jasplakinolide on the kinetics of actin polymerization. An explanation for certain in vivo observations. J. Biol. Chem. 275:5163–5170. - PubMed
    1. Bussell, S. J., D. L. Koch, and D. A. Hammer. 1995. Effect of hydrodynamic interactions on the diffusion of integral membrane proteins: tracer diffusion in organelle and reconstituted membranes. Biophys. J. 68:1828–1835. - PMC - PubMed
    1. Chang, C.-H., H. Takeuchi, T. Ito, K. Machida, and S. Ohnishi. 1981. Lateral mobility of erythrocyte membrane proteins studied by the fluorescence photobleaching recovery technique. J. Biochem. 90:997–1004. - PubMed
    1. De Mey, J. 1983. Colloidal-gold probes in immunocytochemistry. In Immunocytochemistry (Practical Applications in Pathology and Biology). J. M. Polak and S. van Noorden, editors. WRIGHT PSG, Bristol, UK. 83–112.

Substances