. 2004 Jun;86(6):4094-109.
doi: 10.1529/biophysj.103.036962.

The proton-driven rotor of ATP synthase: ohmic conductance (10 fS), and absence of voltage gating

Affiliations

The proton-driven rotor of ATP synthase: ohmic conductance (10 fS), and absence of voltage gating

Boris A Feniouk et al. Biophys J. 2004 Jun.

Abstract

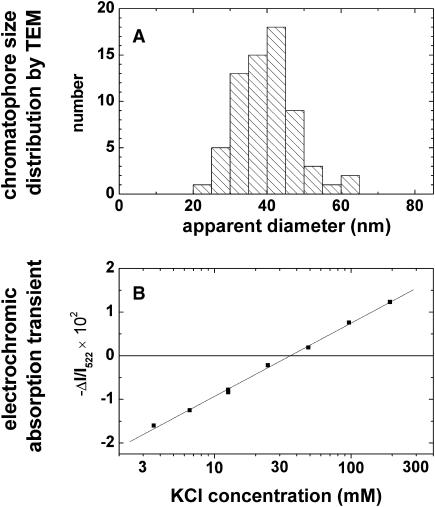
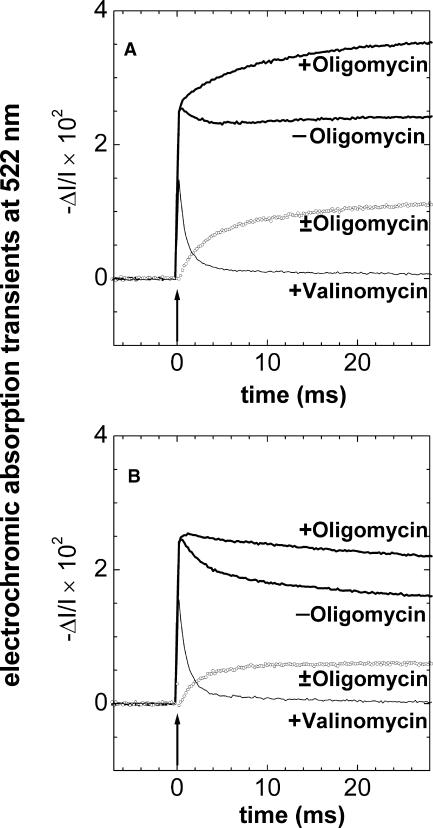
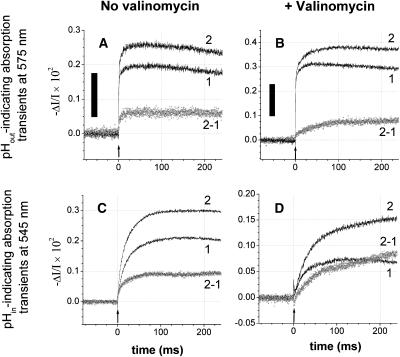
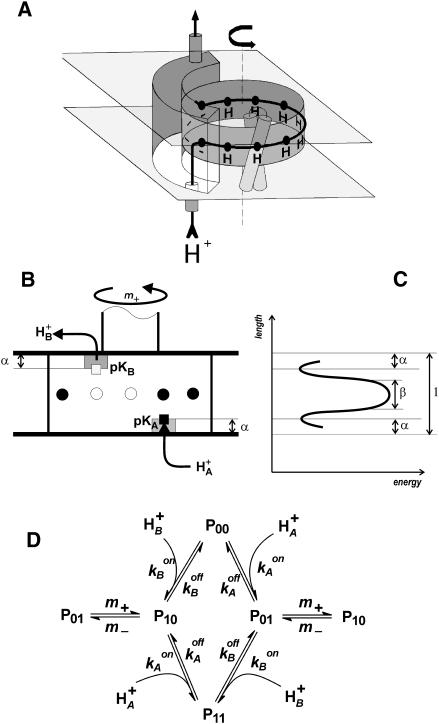
The membrane portion of F(0)F(1)-ATP synthase, F(0), translocates protons by a rotary mechanism. Proton conduction by F(0) was studied in chromatophores of the photosynthetic bacterium Rhodobacter capsulatus. The discharge of a light-induced voltage jump was monitored by electrochromic absorption transients to yield the unitary conductance of F(0). The current-voltage relationship of F(0) was linear from 7 to 70 mV. The current was extremely proton-specific (>10(7)) and varied only slightly ( approximately threefold) from pH 6 to 10. The maximum conductance was approximately 10 fS at pH 8, equivalent to 6240 H(+) s(-1) at 100-mV driving force, which is an order-of-magnitude greater than of coupled F(0)F(1). There was no voltage-gating of F(0) even at low voltage, and proton translocation could be driven by deltapH alone, without voltage. The reported voltage gating in F(0)F(1) is thus attributable to the interaction of F(0) with F(1) but not to F(0) proper. We simulated proton conduction by a minimal rotary model including the rotating c-ring and two relay groups mediating proton exchange between the ring and the respective membrane surface. The data fit attributed pK values of approximately 6 and approximately 10 to these relays, and placed them close to the membrane/electrolyte interface.


Figures

FIGURE 1
FIGURE 1
(A) Size distribution of F1-depleted chromatophores by transmission electron microscopy (TEM). Because of drying on the microscope grid the originally spherical particles appeared as flat disks (see text). (B) Absorption transients attributable to carotenoid bandshifts of electrochromic origin as function of the K+ concentration in the suspending medium. These transients were caused by a diffusion potential that was generated by submitting chromatophores to a K+-concentration jump in the presence of the K+-ionophore valinomycin. F1-depleted chromatophores (940 μM bacteriochlorophyll) were preincubated with 45 mM KCl, 205 mM NaCl, 5 mM MgCl2, 20 mM glycylglycine-NaOH, pH 7.9. The final bacteriochlorophyll concentration in the samples was 12 μM.
FIGURE 2
FIGURE 2
Electrochromic absorption transients at a wavelength of 522 nm in F1-depleted chromatophores as caused by a short flash of light. The upper traces were obtained without and with blocking of F0 by 3 μM oligomycin, respectively. The difference trace (± oligomycin) represents the charge flow across F0 (A) without and (B) with 3 μM myxothiazol added to deactivate the electrogenic and proton pumping activity of the cytochrome bc1 complex. The actinic flash is indicated by an arrow. The bottom traces were obtained in the presence of 1 μM valinomycin to enhance the ion conductance of all chromatophores in the sample. It was apparent that absorption transients not originating from electrochromism as well as any electrochromic responses to localized electric fields were negligible under our conditions. The suspending medium contained: 100 mM KCl, 5 mM magnesium acetate, 2 mM K4[Fe(CN)6], 5 μM 1,1′-dimethylferrocene (DMF), 2 mM KCN, 20 mM glycylglycine-KOH, pH 7.9; chromatophores were added to 12 μM bacteriochlorophyll.
FIGURE 3
FIGURE 3
The rate constant of charge flow through F0 (see Fig. 2 B) as a function of the pH and the isotope composition of the medium (H2O: ○, D2O: •). Medium contained 20 mM glycylglycine, 20 mM sodium phosphate, 20 mM 4-morpholinepropanesulfonic acid (MES), 20 mM glycine, 50 mM KCl, 2 mM K4[Fe(CN)6], 5 μM DMF, 2 mM KCN, 3 μM myxothiazol. The solid line was calculated by the kinetic model of F0 conductance as described in the text with the parameters listed in Table 2.
FIGURE 4
FIGURE 4
Effect of pH on the H/D-isotope effect and on the Arrhenius activation energy of the charge transfer through F0. (A) H/D isotope effect was calculated as the ratio of the rate constants in H2O and D2O (data taken from Fig. 3). (B) The pH-dependence of the Arrhenius activation energy (Ea). Measurements were done in the presence of 3 μM myxothiazol in the temperature interval from 3°C to 40°C. A single experiment was done at pH 9; other points are the average of at least three experiments.
FIGURE 5
FIGURE 5
Transient charge transfer through F0 in the presence of 3 μM myxothiazol as inhibitor of cytochrome-bc1. (A) Two transients of charge flow through F0, both electrochromic differences (± oligomycin) as the bottom trace in Fig. 2 B. ○, the transient recorded under excitation with a flash of saturating energy. Noisy line, the transient recorded at attenuated excitation flash energy to produce 33% signal saturation. The extent after the flash was normalized to unity. The insert maps allowed (uncolored) and forbidden (hatched) area in the parameter-field of α and β (see details in the text). (B) The noisy line represents the difference between the original transients shown in A; a histogram of the deviations is shown in the insert. The thick solid line is the same difference calculated according to the model with the parameters α = 0.05, β = 0.71, γ = 10 (other parameters are listed in Table 2; see details in the text). It is consistent with the experimental error of 3%. The dashed curve was calculated with the same set of parameters except that γ = 1, and the dotted curve was calculated for another set of parameters, namely α = 0.1, β = 0.71, and γ = 10.
FIGURE 6
FIGURE 6
Proton transfer through F0 as monitored by two pH indicators reporting pH transients from either side of the chromatophore membrane, (A, B) from the n-side (Cresol red, 90 μM, at a wavelength of 575 nm), and (C, D) from the p-side (Neutral red, 26 μM plus 0.3% w/v BSA, at 545 nm). Traces in parts A and C were recorded in the absence, and traces B and D in the presence of the ionophore valinomycin (2 μM). In the latter case the transmembrane voltage was collapsed by the valinomycin-mediated K+ current in <3 ms (see Fig. 2). The relaxation of the pH difference was then entirely due to the entropic driving force (ΔpH). The proton release from bc1 was slower in the presence of valinomycin (compare to traces 2 in Figs. 6 C and 5 D). The medium contained 50 mM KCl, 5 mM MgCl2, 2 mM K4[Fe(CN)6], 2 mM KCN, 5 μM dMF; pH was 7.9. Chromatophore stock was in 5 mM MgCl2, 50 mM KCl, 10% sucrose. Traces 1 without, and traces 2 with 3 μM oligomycin added; traces 2-1 = difference trace ± oligomycin. Actinic flashes are marked by arrows; black bars correspond to 0.002 pH units.
FIGURE 7
FIGURE 7
Functional model of F0. (A) Schematic illustration of F0 operation. (B) Simple model for proton transfer; see text for details. (C) Hypothetical energy profile for proton transfer; see text for details. (D) Kinetic scheme.

Similar articles

Cited by

References

    1. Altendorf, K., W. Stalz, J. Greie, and G. Deckers-Hebestreit. 2000. Structure and function of the F0 complex of the ATP synthase from Escherichia coli. J. Exp. Biol. 203:19–28. - PubMed
    1. Althoff, G., H. Lill, and W. Junge. 1989. Proton channel of the chloroplast ATP synthase, CF0: its time- averaged single-channel conductance as function of pH, temperature, isotopic and ionic medium composition. J. Membr. Biol. 108:263–271.
    1. Angevine, C. M., and R. H. Fillingame. 2003. Aqueous access channels in subunit a of rotary ATP synthase. J. Biol. Chem. 278:6066–6074. - PubMed
    1. Ausländer, W., and W. Junge. 1975. Neutral red, a rapid indicator for pH changes in the inner phase of thylakoids. FEBS Lett. 59:310–315.
    1. Baccarini-Melandri, A., H. Gest, and A. S. Pietro. 1970. A coupling factor in bacterial photophosphorylation. J. Biol. Chem. 245:1224–1226. - PubMed

Publication types

LinkOut - more resources