

Characterization of protein glycosylation using chip-based infusion nanoelectrospray linear ion trap tandem mass spectrometry
- PMID: 15190085
- PMCID: PMC2291675
Characterization of protein glycosylation using chip-based infusion nanoelectrospray linear ion trap tandem mass spectrometry
Abstract
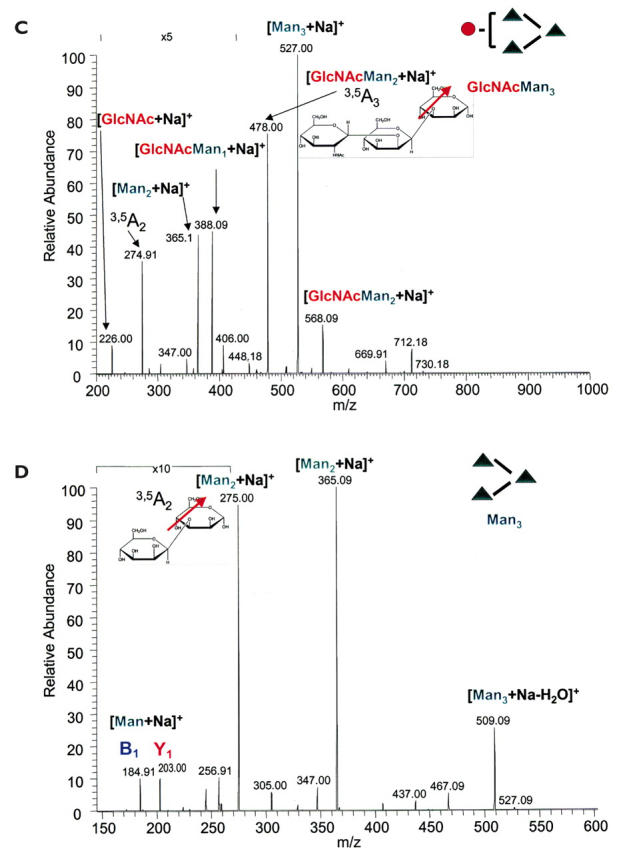
Mass spectrometry (MS) has the potential to revolutionize structural glycobiology and help in the understanding of how post-translation events such as glycosylation affect protein activities. Several approaches to determine the structure of glycopeptides have been used successfully including fast atom bombardment, matrix-assisted laser desorption ionization, and electrospray ionization with a wide variety of mass analyzers. However, the identification of glycopeptides in a complex mixture still remains a challenge. The source of this challenge is primarily due to the poor ionization efficiency and rapid degradation of glycopeptides. In this report we describe the use of a chip-based infusion nanoelectrospray ionization technique in combination with a recently developed linear ion trap for identification and characterization of glycosylation in complex mixtures. Two standard synthetic glycans were analyzed using multiple-stage fragmentation analysis in both positive and negative ionization modes. In addition, the high mannose type N-glycosylation in ribonuclease B (RNase B) was used to map the glycosylation site and obtain the glycan structures. We were able to map the glycosylation site and obtain the glycan structures in RNase B in a single analysis. The results reported here demonstrate that the fully automated chip-based nanoelectrospray linear ion trap platform is a valuable system for oligosaccharide analyses due to the unique MS/MS and MS(n) capability of the linear ion trap and the extended analysis time provided by the ionization technique.
Figures


Similar articles
-
Characterization of protein glycosylation using chip-based nanoelectrospray with precursor ion scanning quadrupole linear ion trap mass spectrometry.J Biomol Tech. 2005 Sep;16(3):209-19. J Biomol Tech. 2005. PMID: 16461944 Free PMC article.
-
Determination of glycopeptide structures by multistage mass spectrometry with low-energy collision-induced dissociation: comparison of electrospray ionization quadrupole ion trap and matrix-assisted laser desorption/ionization quadrupole ion trap reflectron time-of-flight approaches.Rapid Commun Mass Spectrom. 2004;18(14):1575-82. doi: 10.1002/rcm.1521. Rapid Commun Mass Spectrom. 2004. PMID: 15282782
-
Fully automated chip-based mass spectrometry for complex carbohydrate system analysis.Anal Chem. 2004 Apr 1;76(7):2046-54. doi: 10.1021/ac035320q. Anal Chem. 2004. PMID: 15053670
-
Glycoproteomics based on tandem mass spectrometry of glycopeptides.J Chromatogr B Analyt Technol Biomed Life Sci. 2007 Apr 15;849(1-2):115-28. doi: 10.1016/j.jchromb.2006.09.041. Epub 2006 Oct 17. J Chromatogr B Analyt Technol Biomed Life Sci. 2007. PMID: 17049937 Review.
-
Mucin-type O-glycosylation--putting the pieces together.FEBS J. 2010 Jan;277(1):81-94. doi: 10.1111/j.1742-4658.2009.07429.x. Epub 2009 Nov 17. FEBS J. 2010. PMID: 19919547 Review.
Cited by
-
A novel approach for identification and characterization of glycoproteins using a hybrid linear ion trap/FT-ICR mass spectrometer.J Am Soc Mass Spectrom. 2006 Feb;17(2):168-79. doi: 10.1016/j.jasms.2005.10.008. Epub 2006 Jan 10. J Am Soc Mass Spectrom. 2006. PMID: 16406561
-
Characterization of protein glycosylation using chip-based nanoelectrospray with precursor ion scanning quadrupole linear ion trap mass spectrometry.J Biomol Tech. 2005 Sep;16(3):209-19. J Biomol Tech. 2005. PMID: 16461944 Free PMC article.
-
Recent advances in the MS analysis of glycoproteins: Capillary and microfluidic workflows.Electrophoresis. 2011 Jan;32(1):14-29. doi: 10.1002/elps.201000394. Epub 2010 Nov 25. Electrophoresis. 2011. PMID: 21171110 Free PMC article. Review.
-
Immunologic mapping of glycomes: implications for cancer diagnosis and therapy.Front Biosci (Schol Ed). 2011 Jun 1;3(4):1520-32. doi: 10.2741/242. Front Biosci (Schol Ed). 2011. PMID: 21622287 Free PMC article. Review.
-
At-line high throughput site-specific glycan profiling using targeted mass spectrometry.Biotechnol Rep (Amst). 2020 Jan 22;25:e00424. doi: 10.1016/j.btre.2020.e00424. eCollection 2020 Mar. Biotechnol Rep (Amst). 2020. PMID: 32071892 Free PMC article.
References
-
- Dwek RA. Glycobiology: more functions for oligosaccharides. Science 1995;269:1234–1235. - PubMed
-
- Helenius A, Aebi M. Intracellular functions of N-linked glycans. Science 2001;291:2364–2369. - PubMed
-
- Kornfeld R, Kornfeld S. Assembly of asparagine-linked oligosaccharides. Annu Rev Biochem 1985, 54:631–664. - PubMed
-
- Paulson J C. Glycoproteins: What are the sugar chains for? Trends Biochem Sci 1989;14:272–276. - PubMed
-
- Dell A, Morris HR. Glycoprotein structure determination by mass spectrometry. Science 2001;291:2351–2356. - PubMed
MeSH terms
Substances
LinkOut - more resources
Full Text Sources
Research Materials
Miscellaneous