

Locus ceruleus control of state-dependent gene expression
- PMID: 15190114
- PMCID: PMC6729294
- DOI: 10.1523/JNEUROSCI.0949-04.2004
Locus ceruleus control of state-dependent gene expression
Abstract
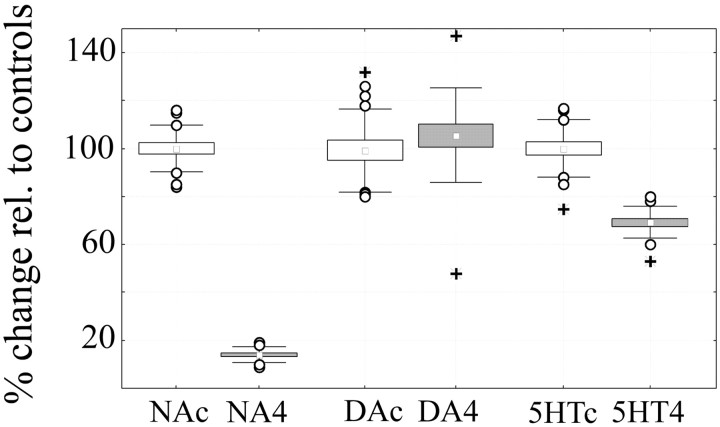
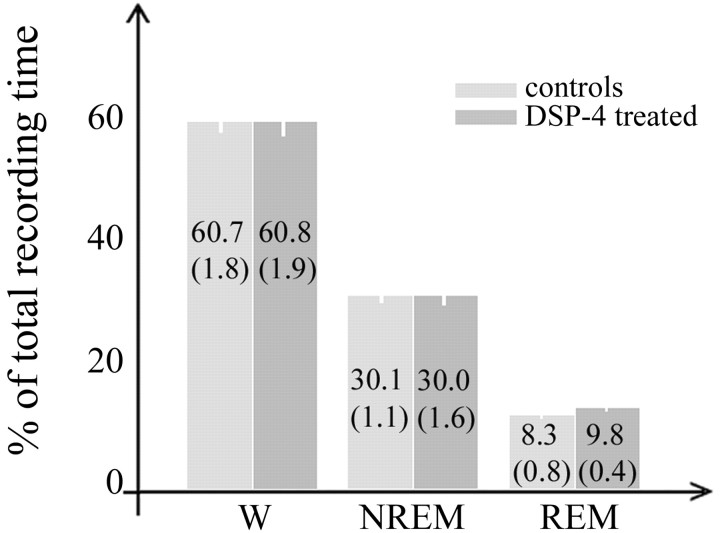
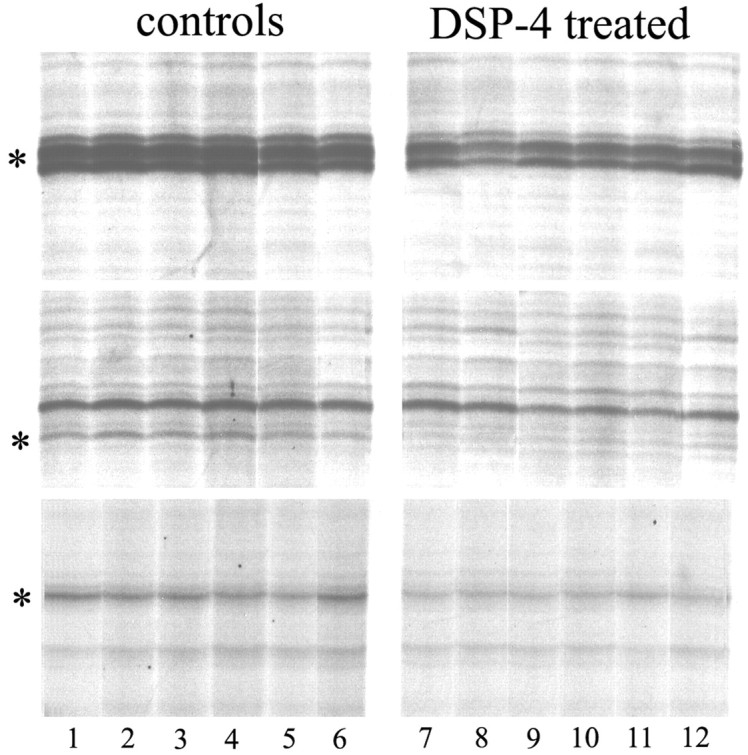
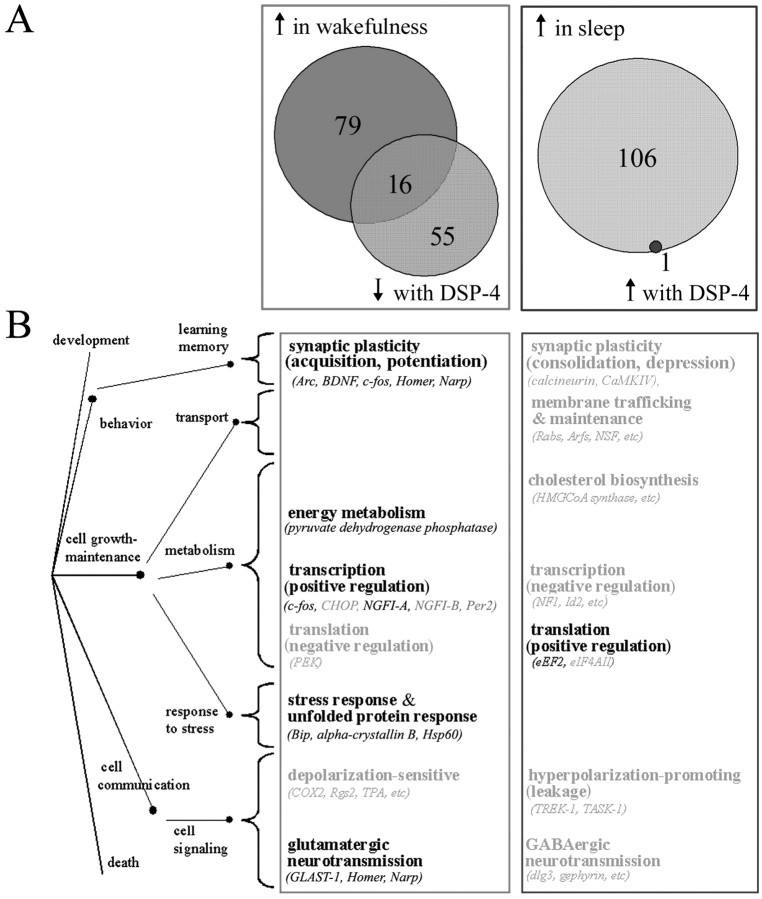
Wakefulness and sleep are accompanied by changes in behavior and neural activity, as well as by the upregulation of different functional categories of genes. However, the mechanisms responsible for such state-dependent changes in gene expression are unknown. Here we investigate to what extent state-dependent changes in gene expression depend on the central noradrenergic (NA) system, which is active in wakefulness and reduces its firing during sleep. We measured the levels of approximately 5000 transcripts expressed in the cerebral cortex of control rats and in rats pretreated with DSP-4 [N-(2-chloroethyl)-N-ethyl-2-bromobenzylamine], a neurotoxin that removes the noradrenergic innervation of the cortex. We found that NA depletion reduces the expression of approximately 20% of known wakefulness-related transcripts. Most of these transcripts are involved in synaptic plasticity and in the cellular response to stress. In contrast, NA depletion increased the expression of the sleep-related gene encoding the translation elongation factor 2. These results indicate that the activity of the central NA system during wakefulness modulates neuronal transcription to favor synaptic potentiation and counteract cellular stress, whereas its inactivity during sleep may play a permissive role to enhance brain protein synthesis.
Figures
Similar articles
-
Locus ceruleus control of slow-wave homeostasis.J Neurosci. 2005 May 4;25(18):4503-11. doi: 10.1523/JNEUROSCI.4845-04.2005. J Neurosci. 2005. PMID: 15872097 Free PMC article.
-
Developmental emergence of power-law wake behavior depends upon the functional integrity of the locus coeruleus.Sleep. 2009 Jul;32(7):920-6. doi: 10.1093/sleep/32.7.920. Sleep. 2009. PMID: 19639755 Free PMC article.
-
The locus coeruleus and immediate-early genes in spontaneous and forced wakefulness.Brain Res Bull. 1994;35(5-6):589-96. doi: 10.1016/0361-9230(94)90173-2. Brain Res Bull. 1994. PMID: 7859116
-
A molecular window on sleep: changes in gene expression between sleep and wakefulness.Neuroscientist. 2005 Feb;11(1):63-74. doi: 10.1177/1073858404270900. Neuroscientist. 2005. PMID: 15632279 Review.
-
Brainstem neural mechanisms of sleep and wakefulness.Eur Urol. 1998;33 Suppl 3:12-5. doi: 10.1159/000052235. Eur Urol. 1998. PMID: 9599730 Review.
Cited by
-
Locus ceruleus control of slow-wave homeostasis.J Neurosci. 2005 May 4;25(18):4503-11. doi: 10.1523/JNEUROSCI.4845-04.2005. J Neurosci. 2005. PMID: 15872097 Free PMC article.
-
Optogenetic Investigation of Arousal Circuits.Int J Mol Sci. 2017 Aug 15;18(8):1773. doi: 10.3390/ijms18081773. Int J Mol Sci. 2017. PMID: 28809797 Free PMC article. Review.
-
An Adaptive Role for DNA Double-Strand Breaks in Hippocampus-Dependent Learning and Memory.Int J Mol Sci. 2022 Jul 28;23(15):8352. doi: 10.3390/ijms23158352. Int J Mol Sci. 2022. PMID: 35955487 Free PMC article. Review.
-
From genetics to structure to function: exploring sleep in Drosophila.Int Rev Neurobiol. 2011;99:213-44. doi: 10.1016/B978-0-12-387003-2.00009-4. Int Rev Neurobiol. 2011. PMID: 21906542 Free PMC article. Review.
-
Colocalization of immediate early genes in catecholamine cells after song exposure in female zebra finches (Taeniopygia guttata).Brain Behav Evol. 2012;79(4):252-60. doi: 10.1159/000337533. Epub 2012 May 3. Brain Behav Evol. 2012. PMID: 22572406 Free PMC article.
References
-
- Akhtar RA, Reddy AB, Maywood ES, Clayton JD, King VM, Smith AG, Gant TW, Hastings MH, Kyriacou CP (2002) Circadian cycling of the mouse liver transcriptome, as revealed by cDNA microarray, is driven by the suprachiasmatic nucleus. Curr Biol 12: 540-550. - PubMed
-
- Bloom FE (1971) Fine structural changes in rat brain after intracisternal injection of 6-hydroxydopamine. In: 6-Hydroxydopamine and catecholamine neurons (Malmfors T, Thoenen H, eds), pp 135-150. Amsterdam: North-Holland.
-
- Bolstad BM, Irizarry RA, Astrand M, Speed TP (2003) A comparison of normalization methods for high density oligonucleotide array data based on variance and bias. Bioinformatics 19: 185-193. - PubMed
Publication types
MeSH terms
Substances
LinkOut - more resources
Full Text Sources
Miscellaneous