

Implementing a public web based GIS service for feedback of surveillance data on communicable diseases in Sweden
- PMID: 15191619
- PMCID: PMC441378
- DOI: 10.1186/1471-2334-4-17
Implementing a public web based GIS service for feedback of surveillance data on communicable diseases in Sweden
Abstract
Background: Surveillance data allow for analysis, providing public health officials and policy-makers with a basis for long-term priorities and timely information on possible outbreaks for rapid response (data for action). In this article we describe the considerations and technology behind a newly introduced public web tool in Sweden for easy retrieval of county and national surveillance data on communicable diseases.
Methods: The web service was designed to automatically present updated surveillance statistics of some 50 statutory notifiable diseases notified to the Swedish Institute for Infectious Disease Control (SMI). The surveillance data is based on clinical notifications from the physician having treated the patient and laboratory notifications, merged into cases using a unique personal identification number issued to all Swedish residents. The web service use notification data from 1997 onwards, stored in a relational database at the SMI.
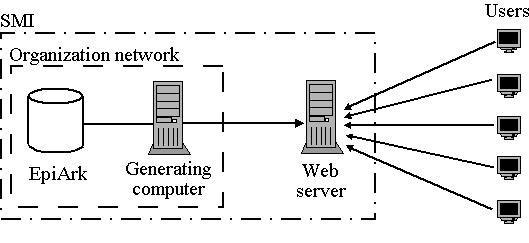
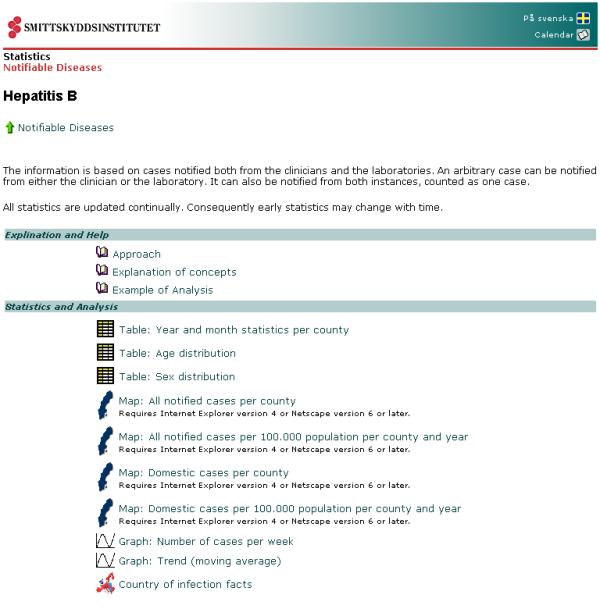
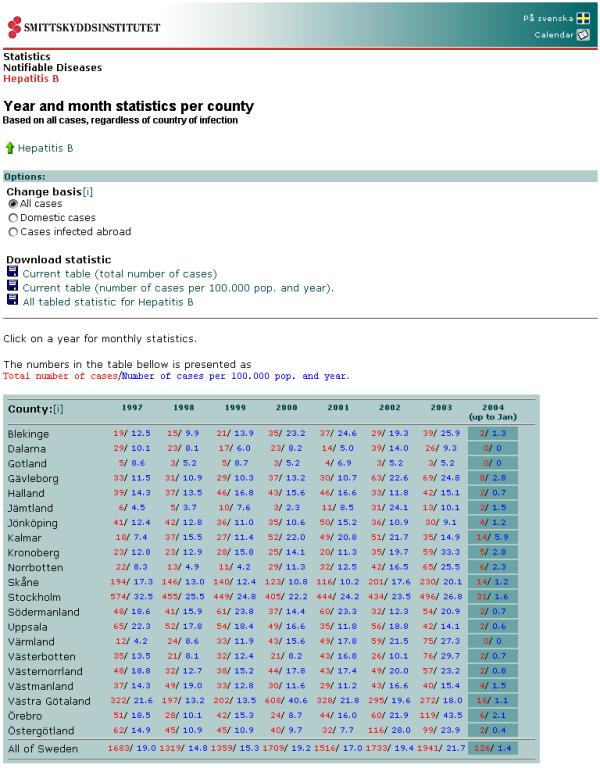
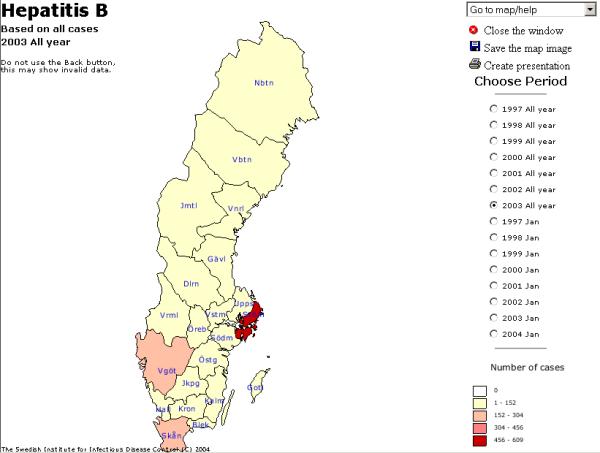
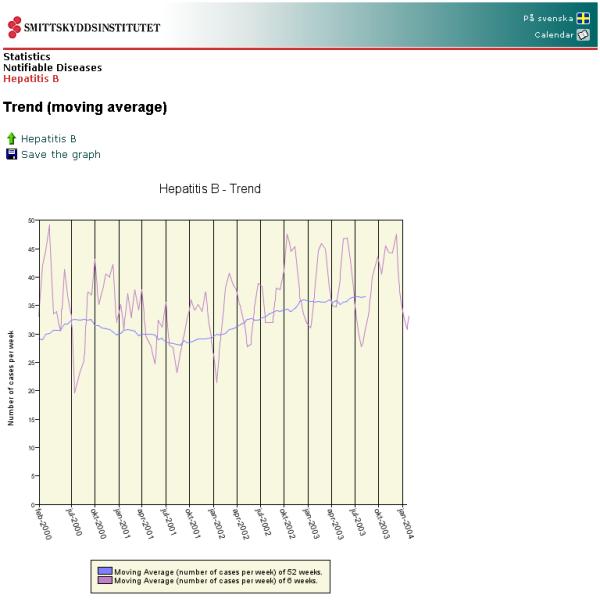
Results: The web service presents surveillance data to the user in various ways; tabulated data containing yearly and monthly disease data per county, age and sex distribution, interactive maps illustrating the total number of cases and the incidence per county and time period, graphs showing the total number of cases per week and graphs illustrating trends in the disease data. The system design encompasses the database (storing the data), the web server (holding the web service) and an in-the-middle computer (to ensure good security standards).
Conclusions: The web service has provided the health community, the media, and the public with easy access to both timely and detailed surveillance data presented in various forms. Since it was introduced in May 2003, the system has been accessed more than 1,000,000 times, by more than 10,000 different viewers (over 12.600 unique IP-numbers).
Figures
References
-
- Teutsch SM, Churchill RE, eds . Principles and practice of public health surveillance. 2. Oxford: Oxford University Press; 2000.
-
- Inventory of resources for infectious diseases in Europe http://iride.cineca.org/ retrieved February 19, 2004.
MeSH terms
LinkOut - more resources
Full Text Sources
Medical
