Comparative Study
. 2004 Oct;31(4):382-94.
doi: 10.1165/rcmb.2004-0060OC. Epub 2004 Jun 10.

Mucin is produced by clara cells in the proximal airways of antigen-challenged mice

Affiliations
Comparative Study

Mucin is produced by clara cells in the proximal airways of antigen-challenged mice

Christopher M Evans et al. Am J Respir Cell Mol Biol. 2004 Oct.

Abstract

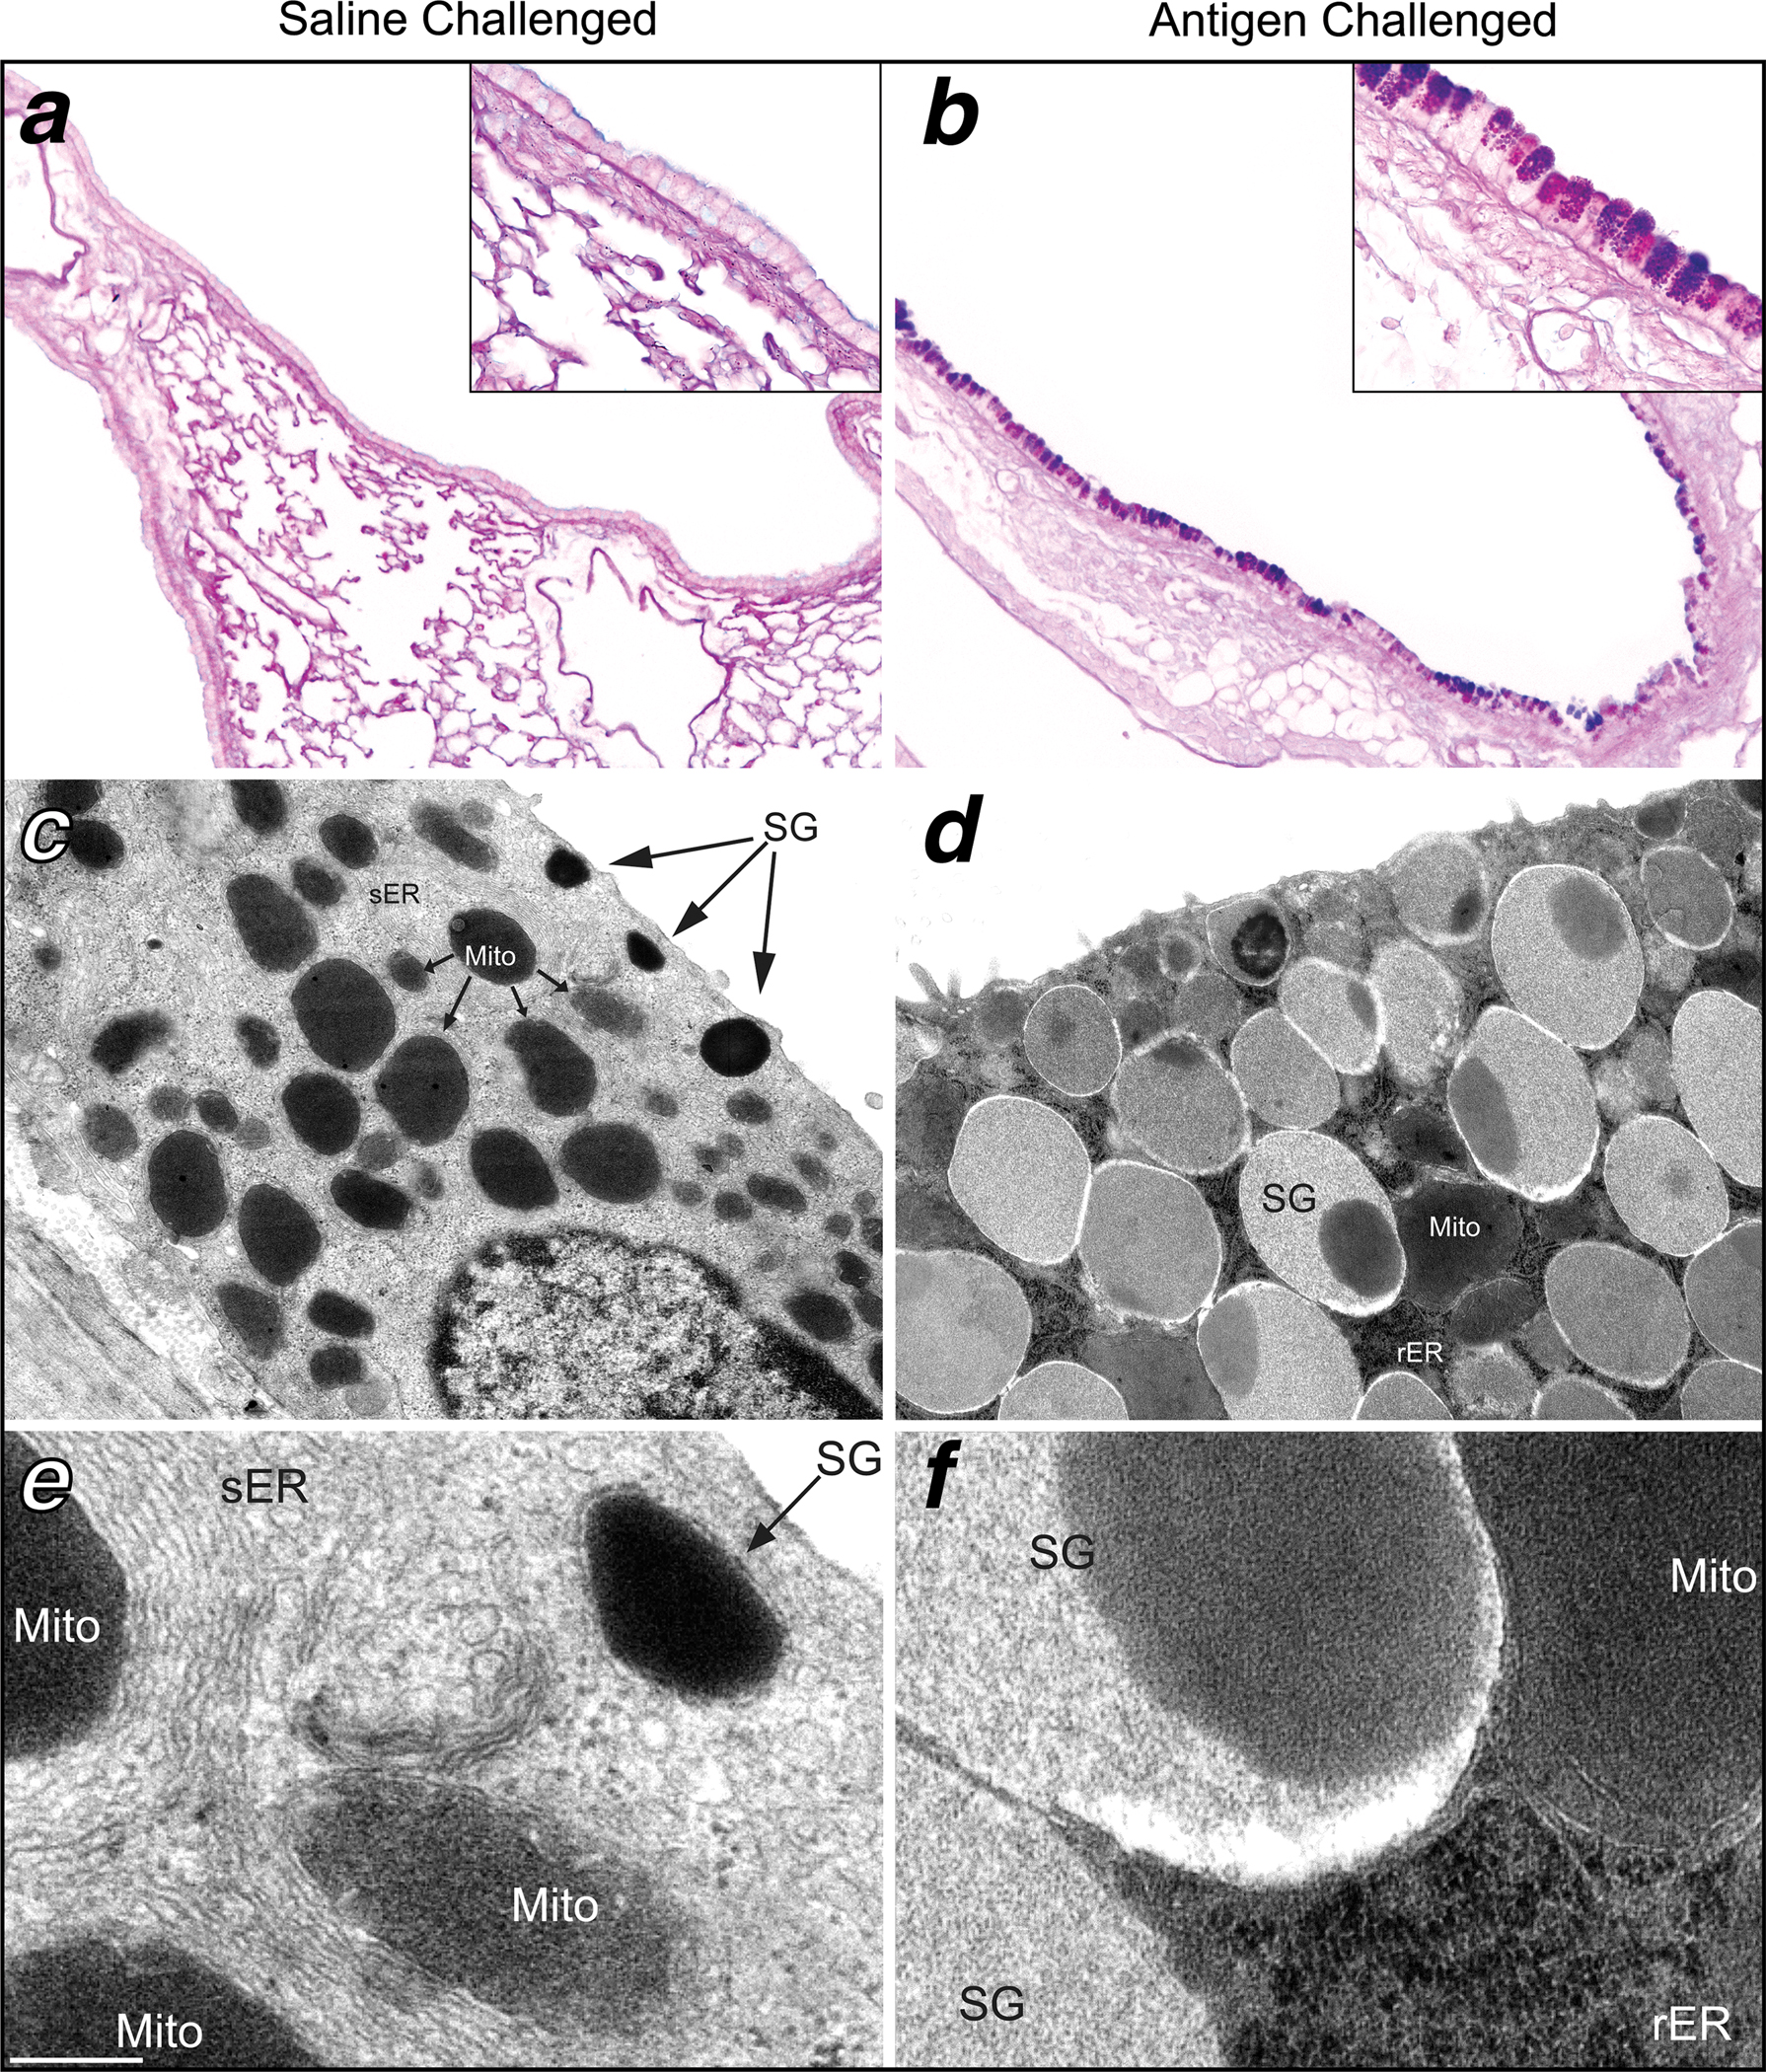
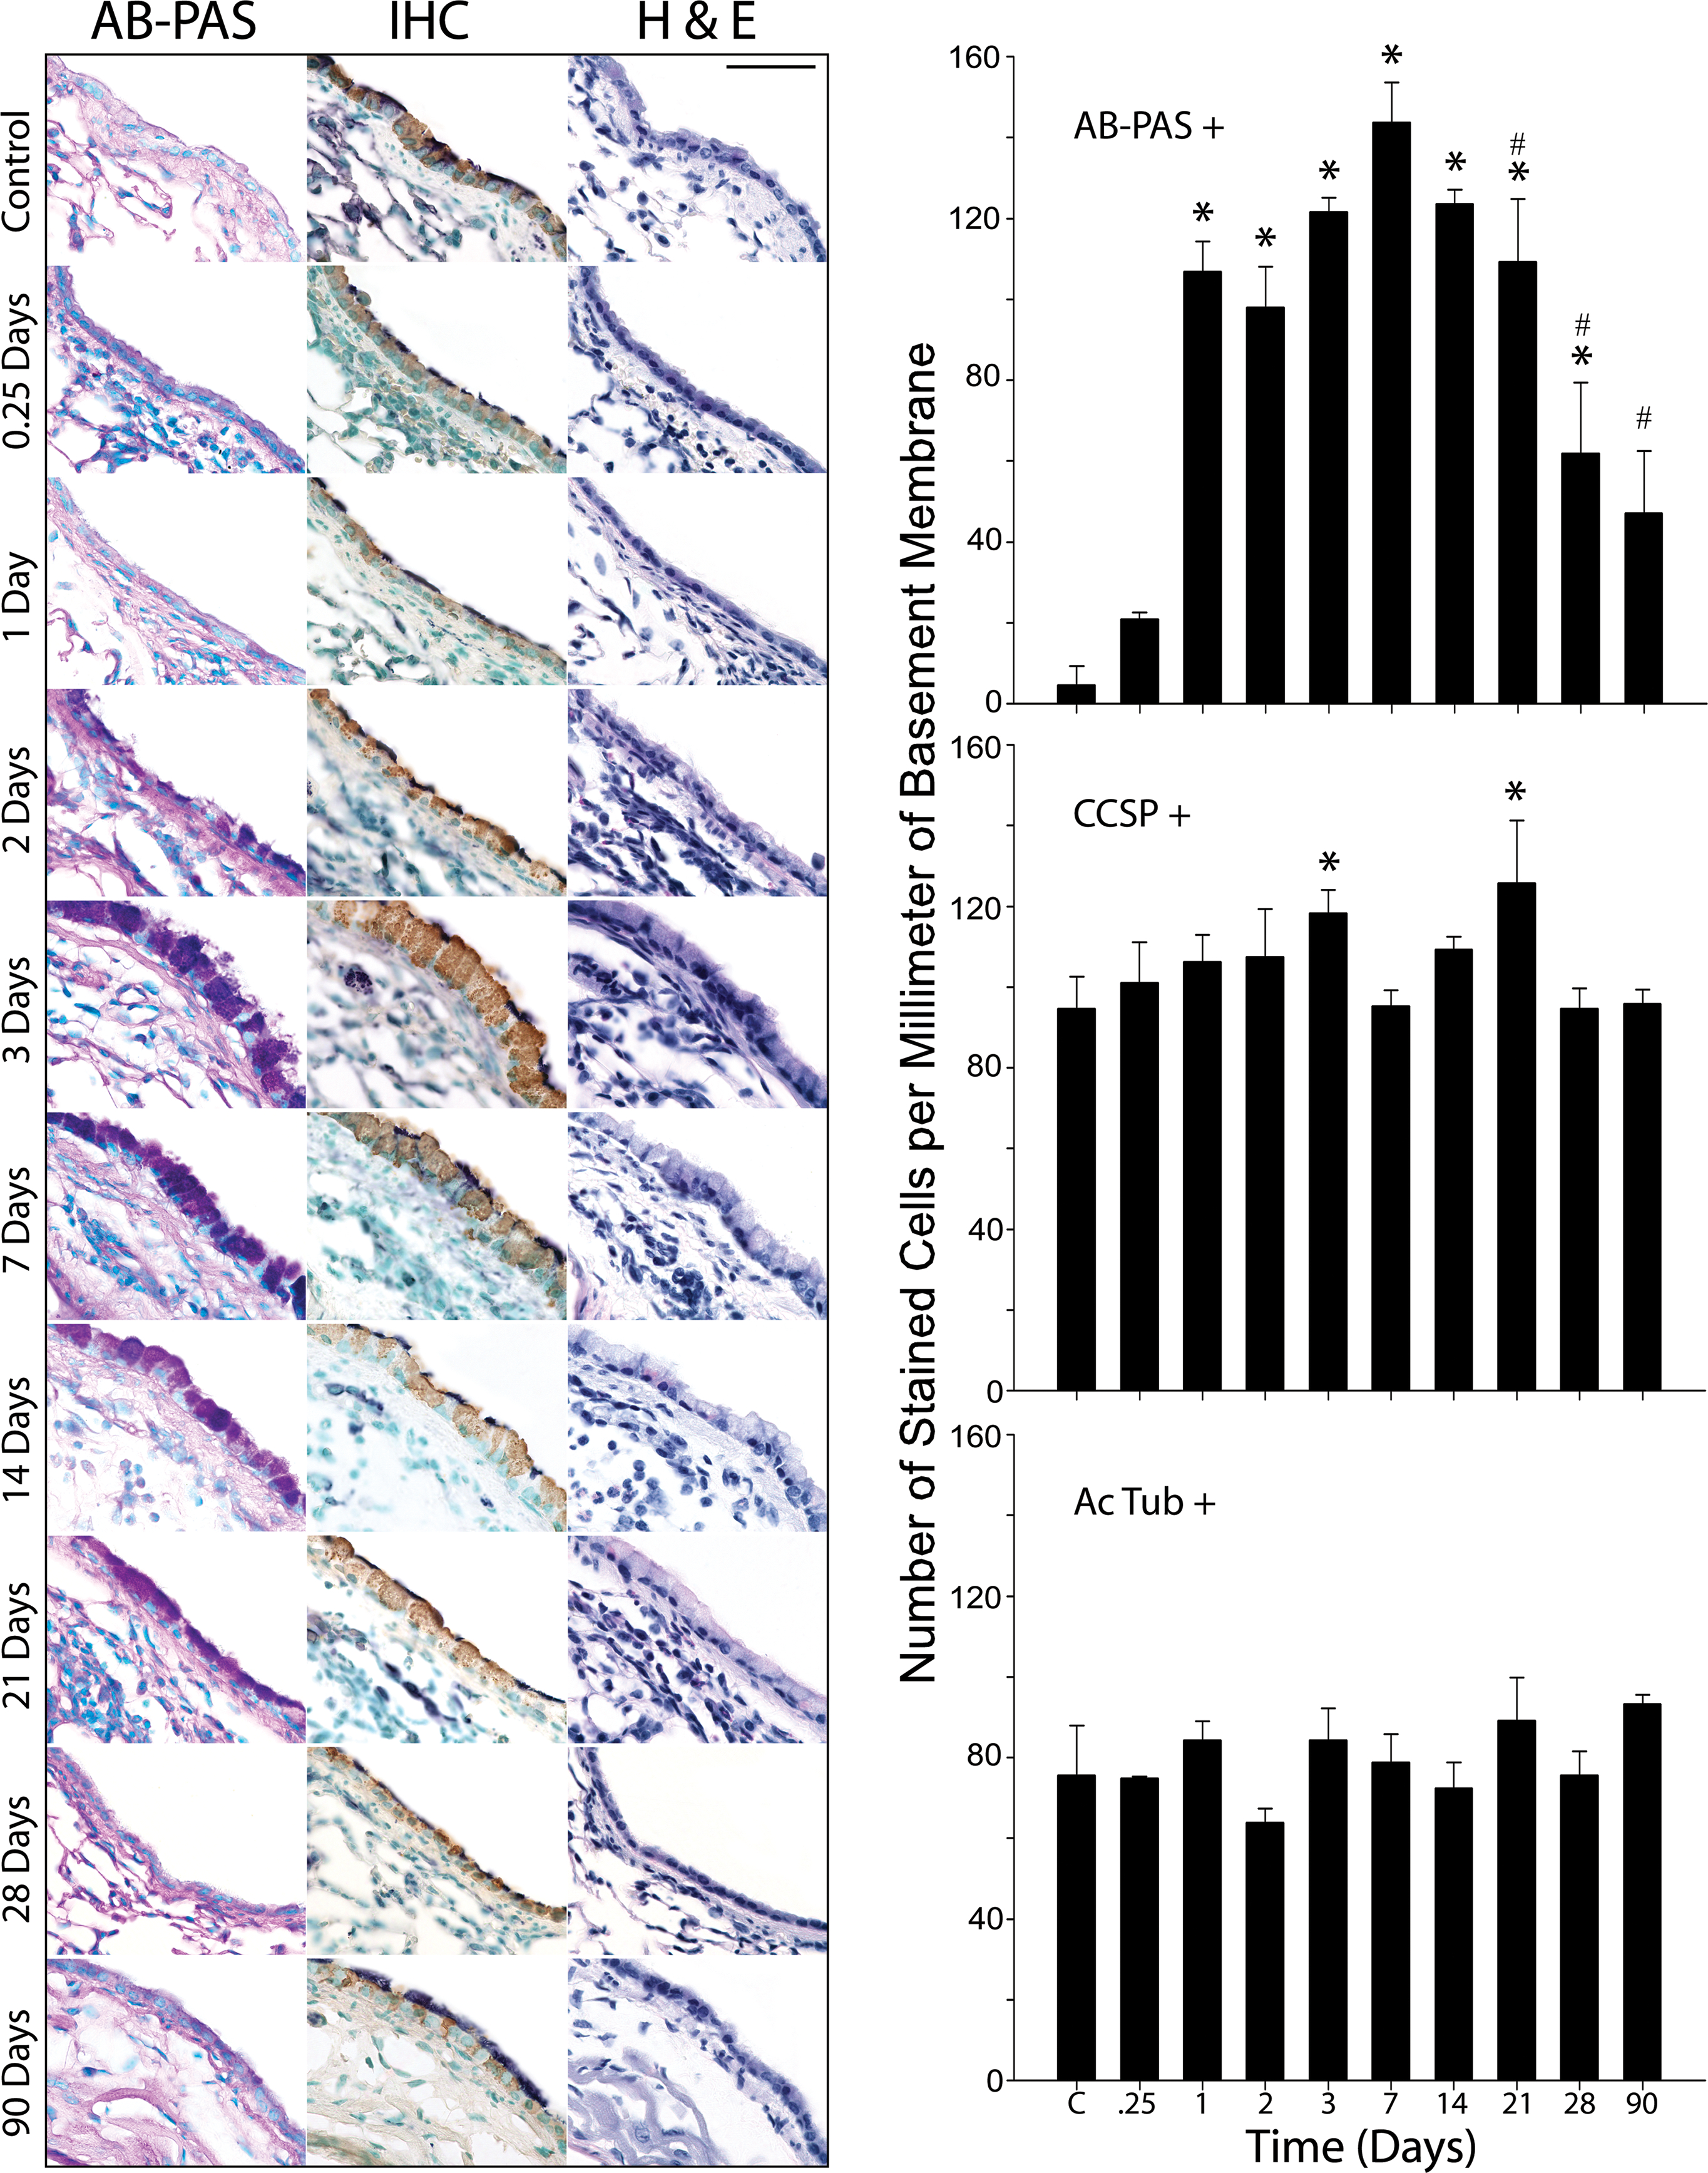
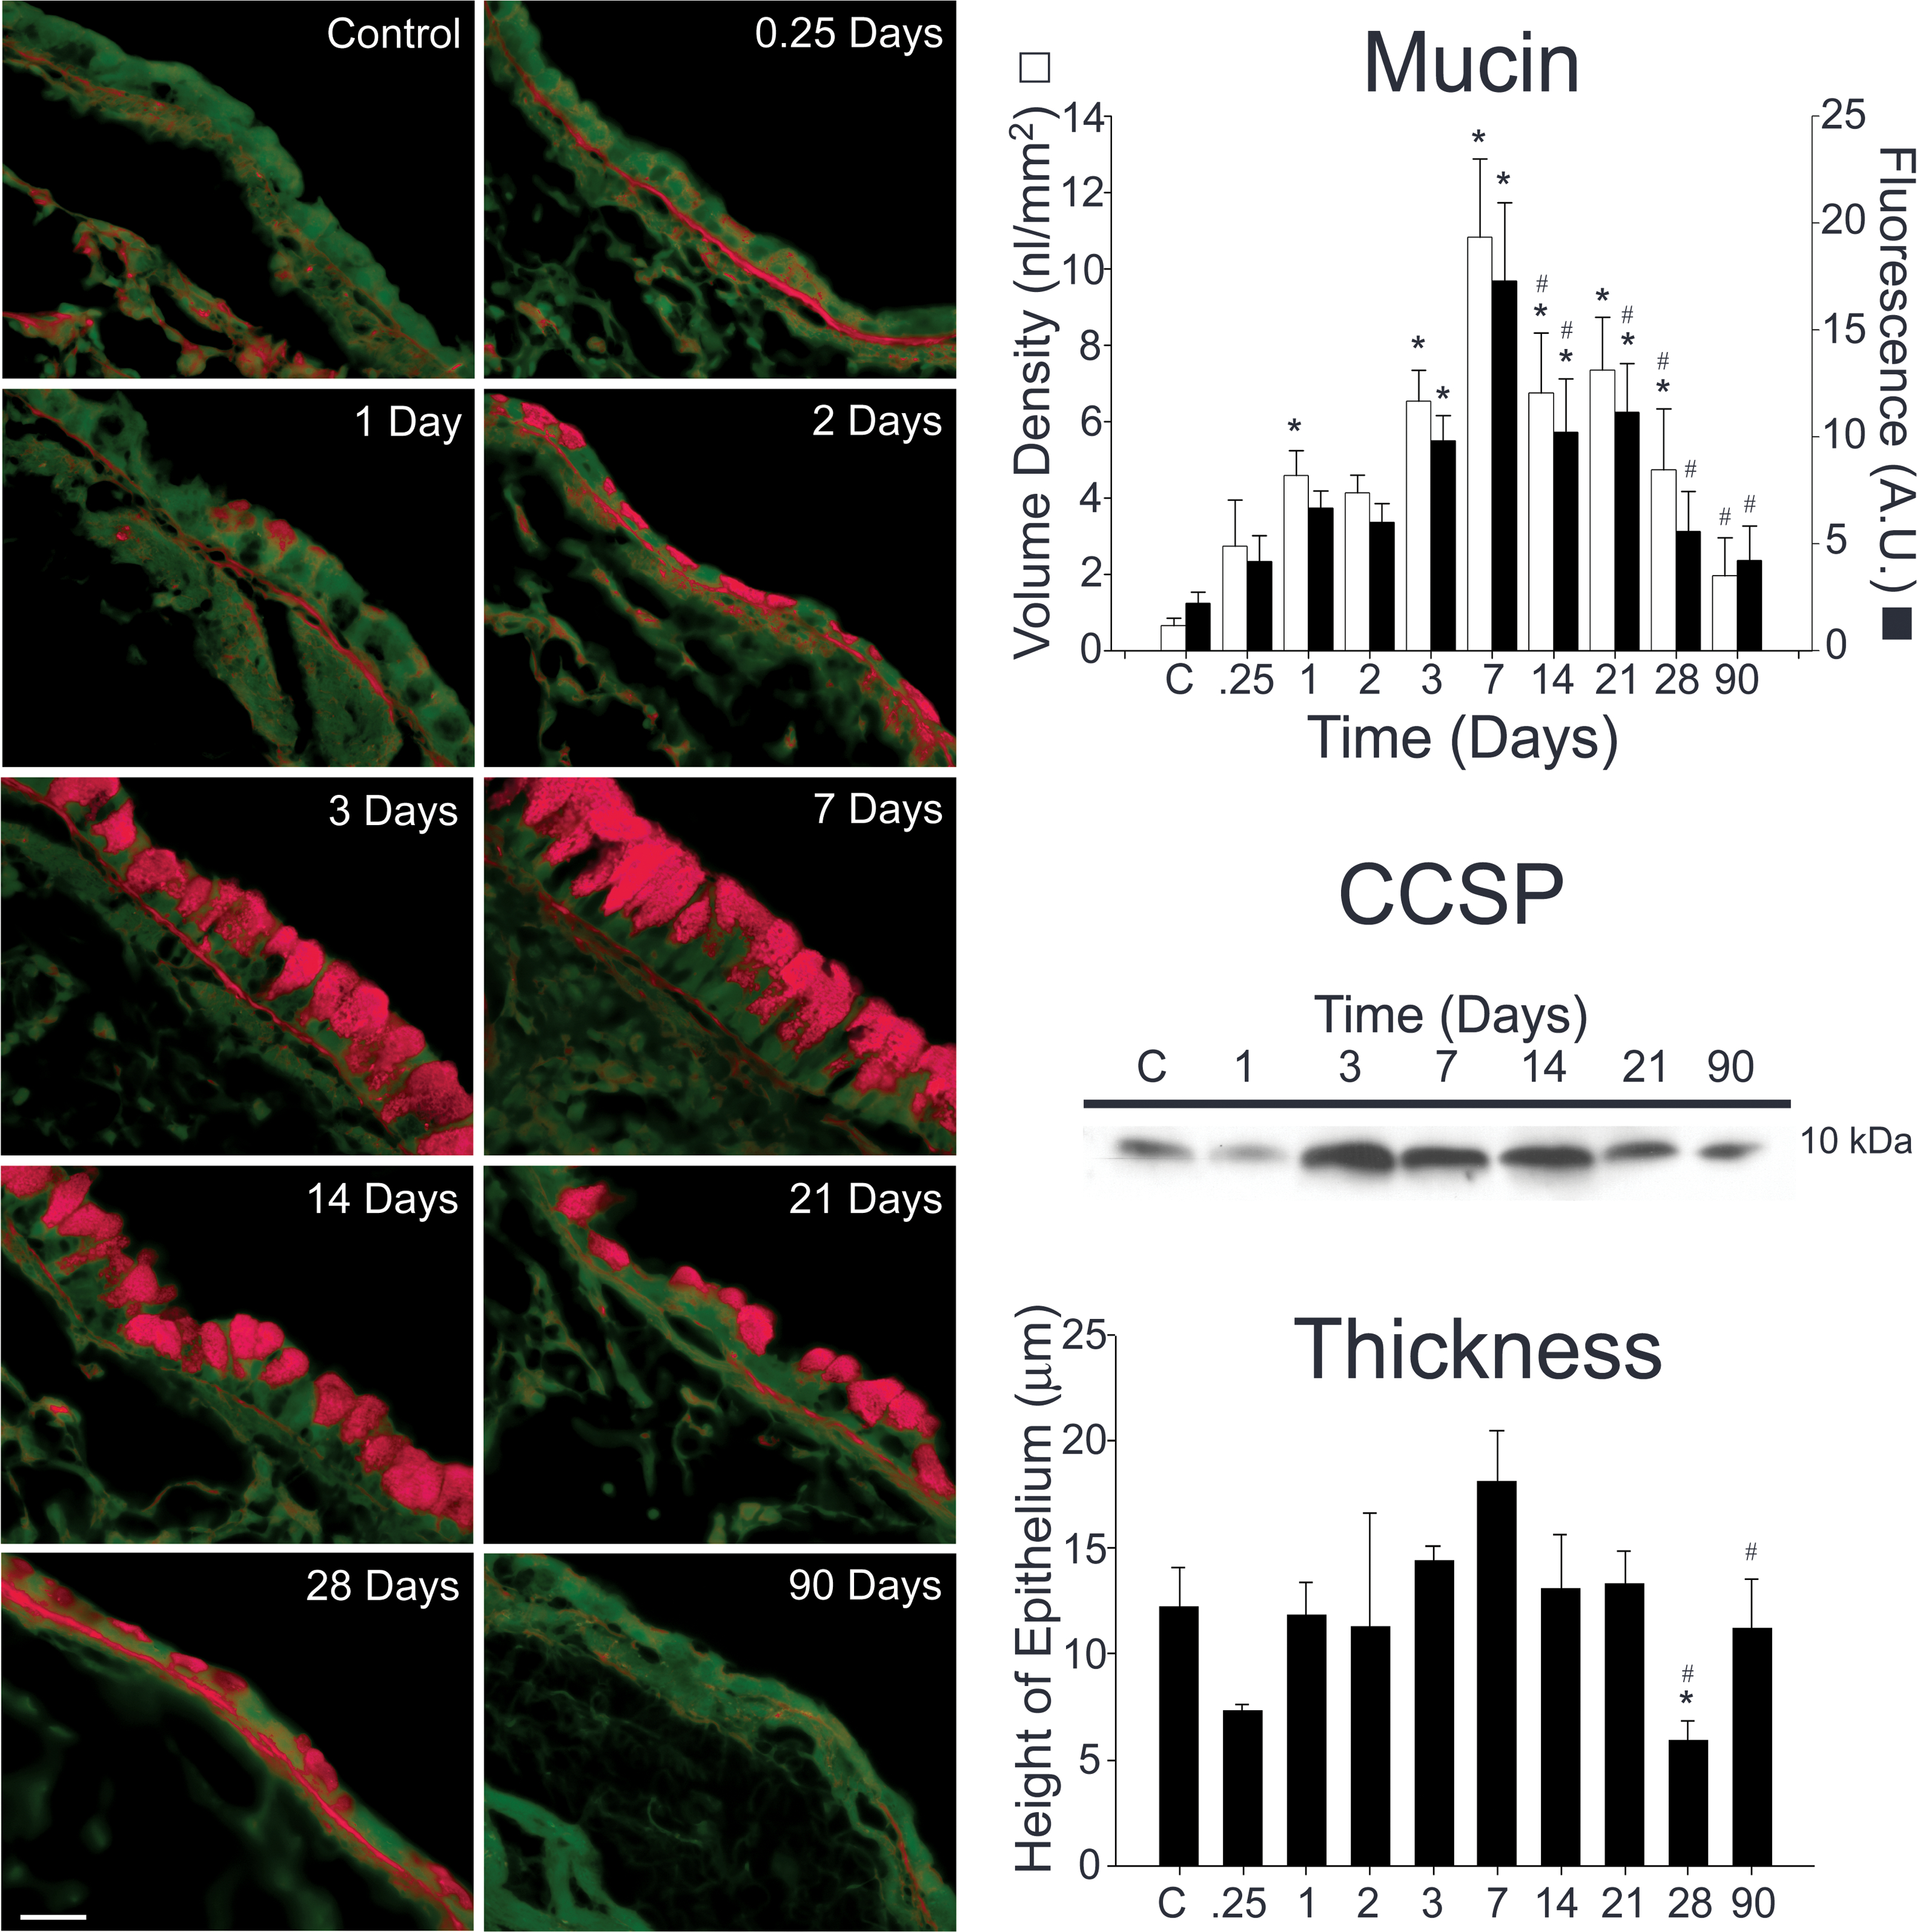
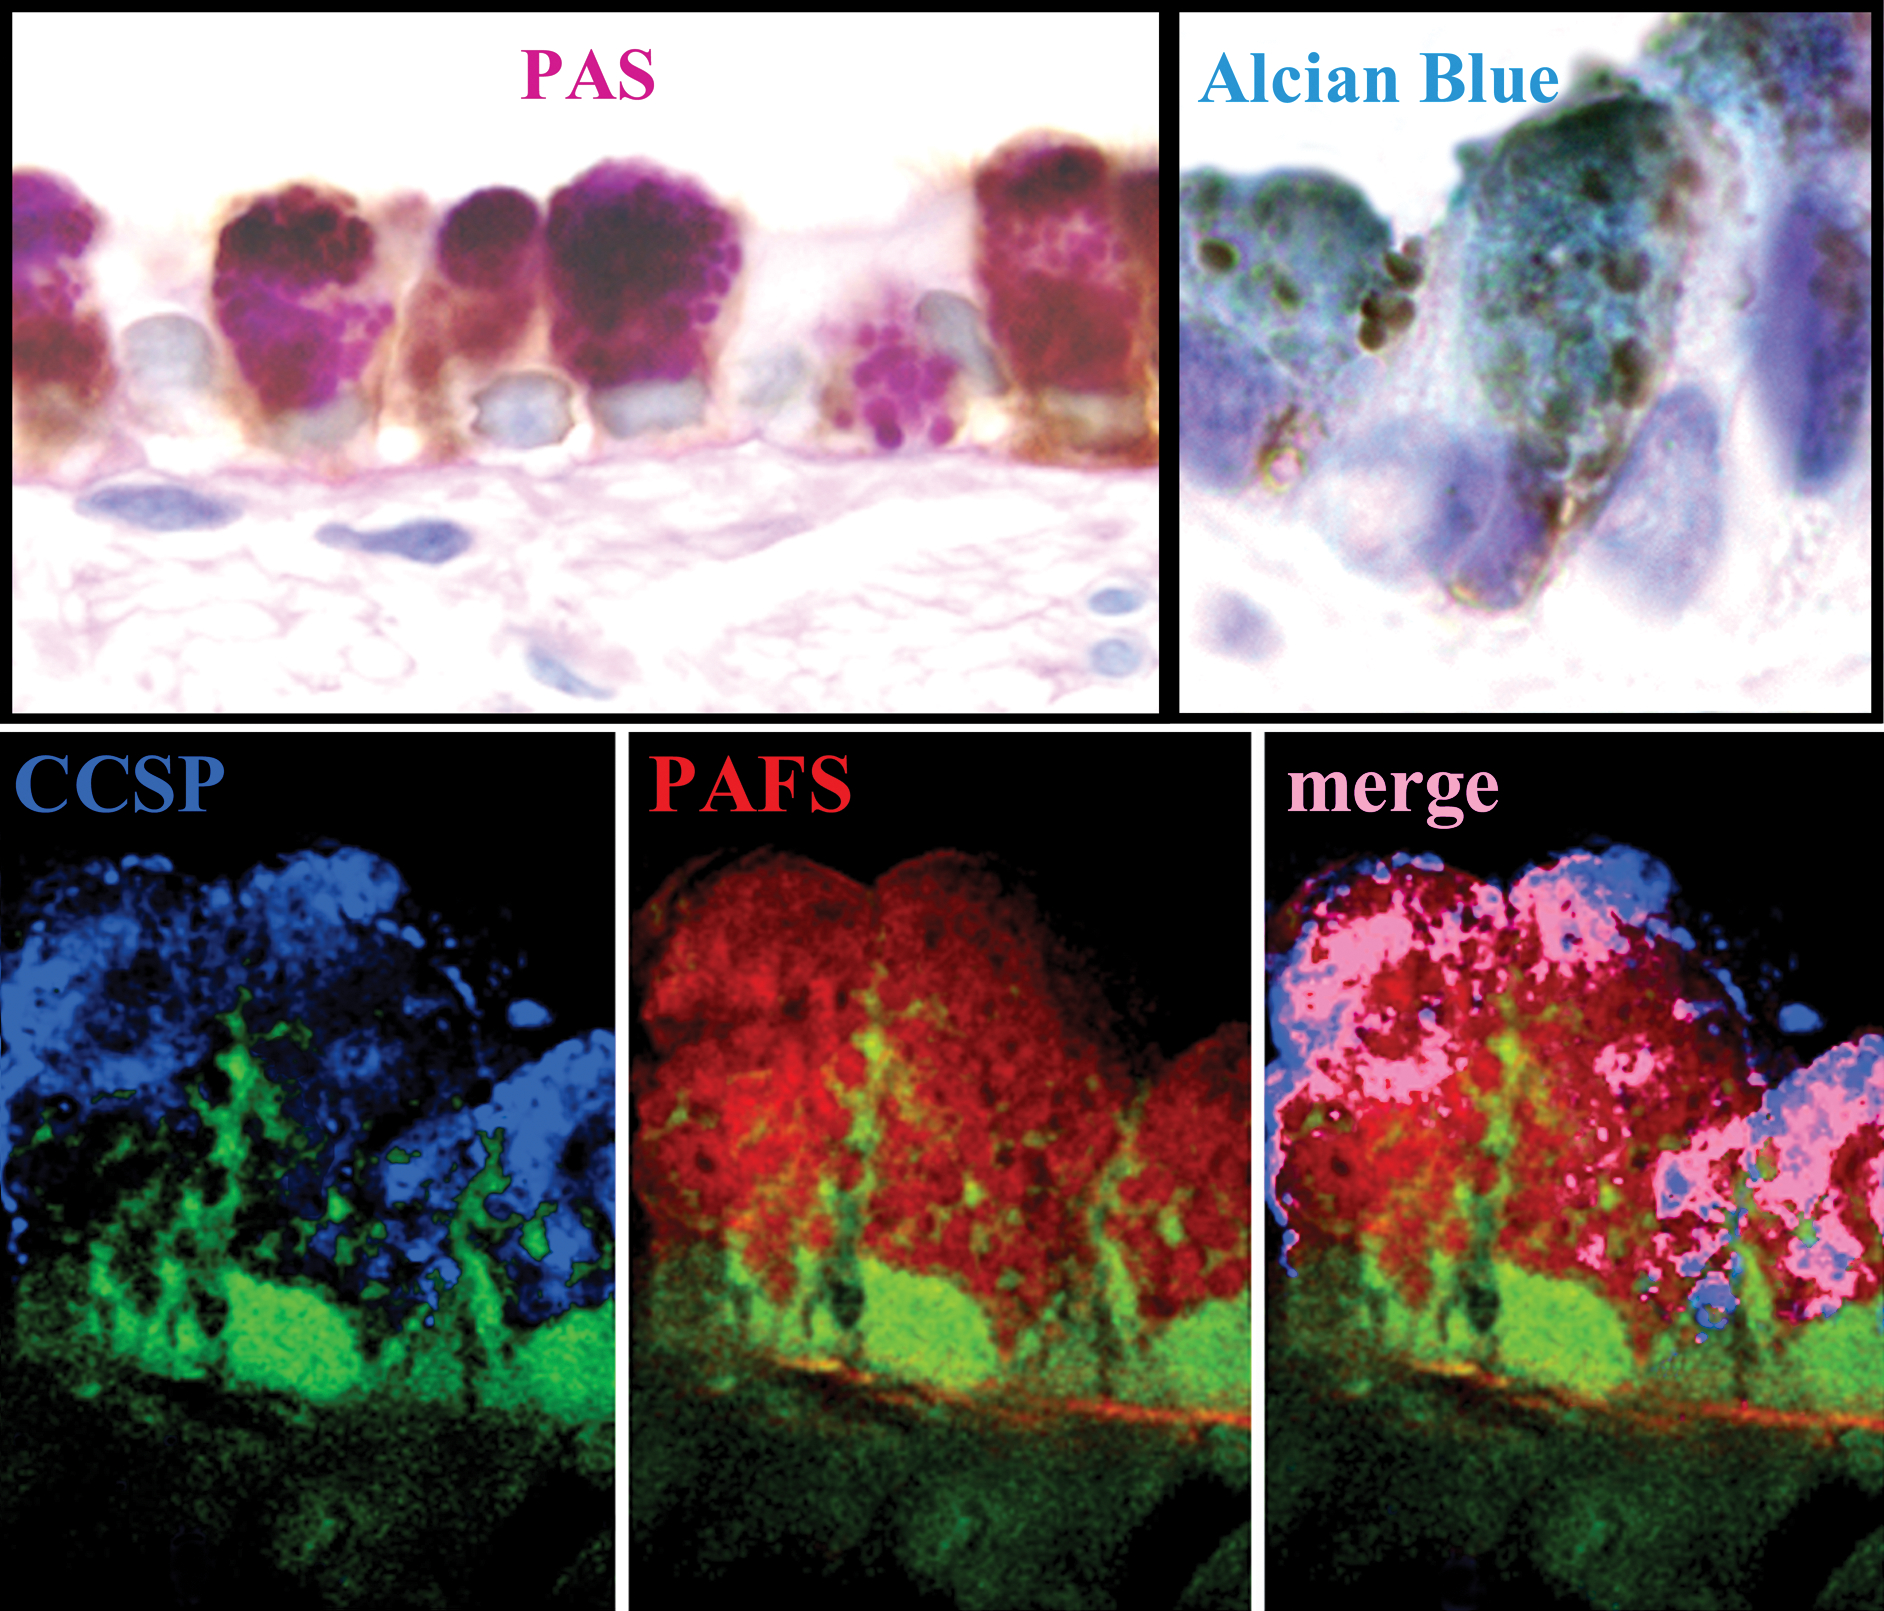
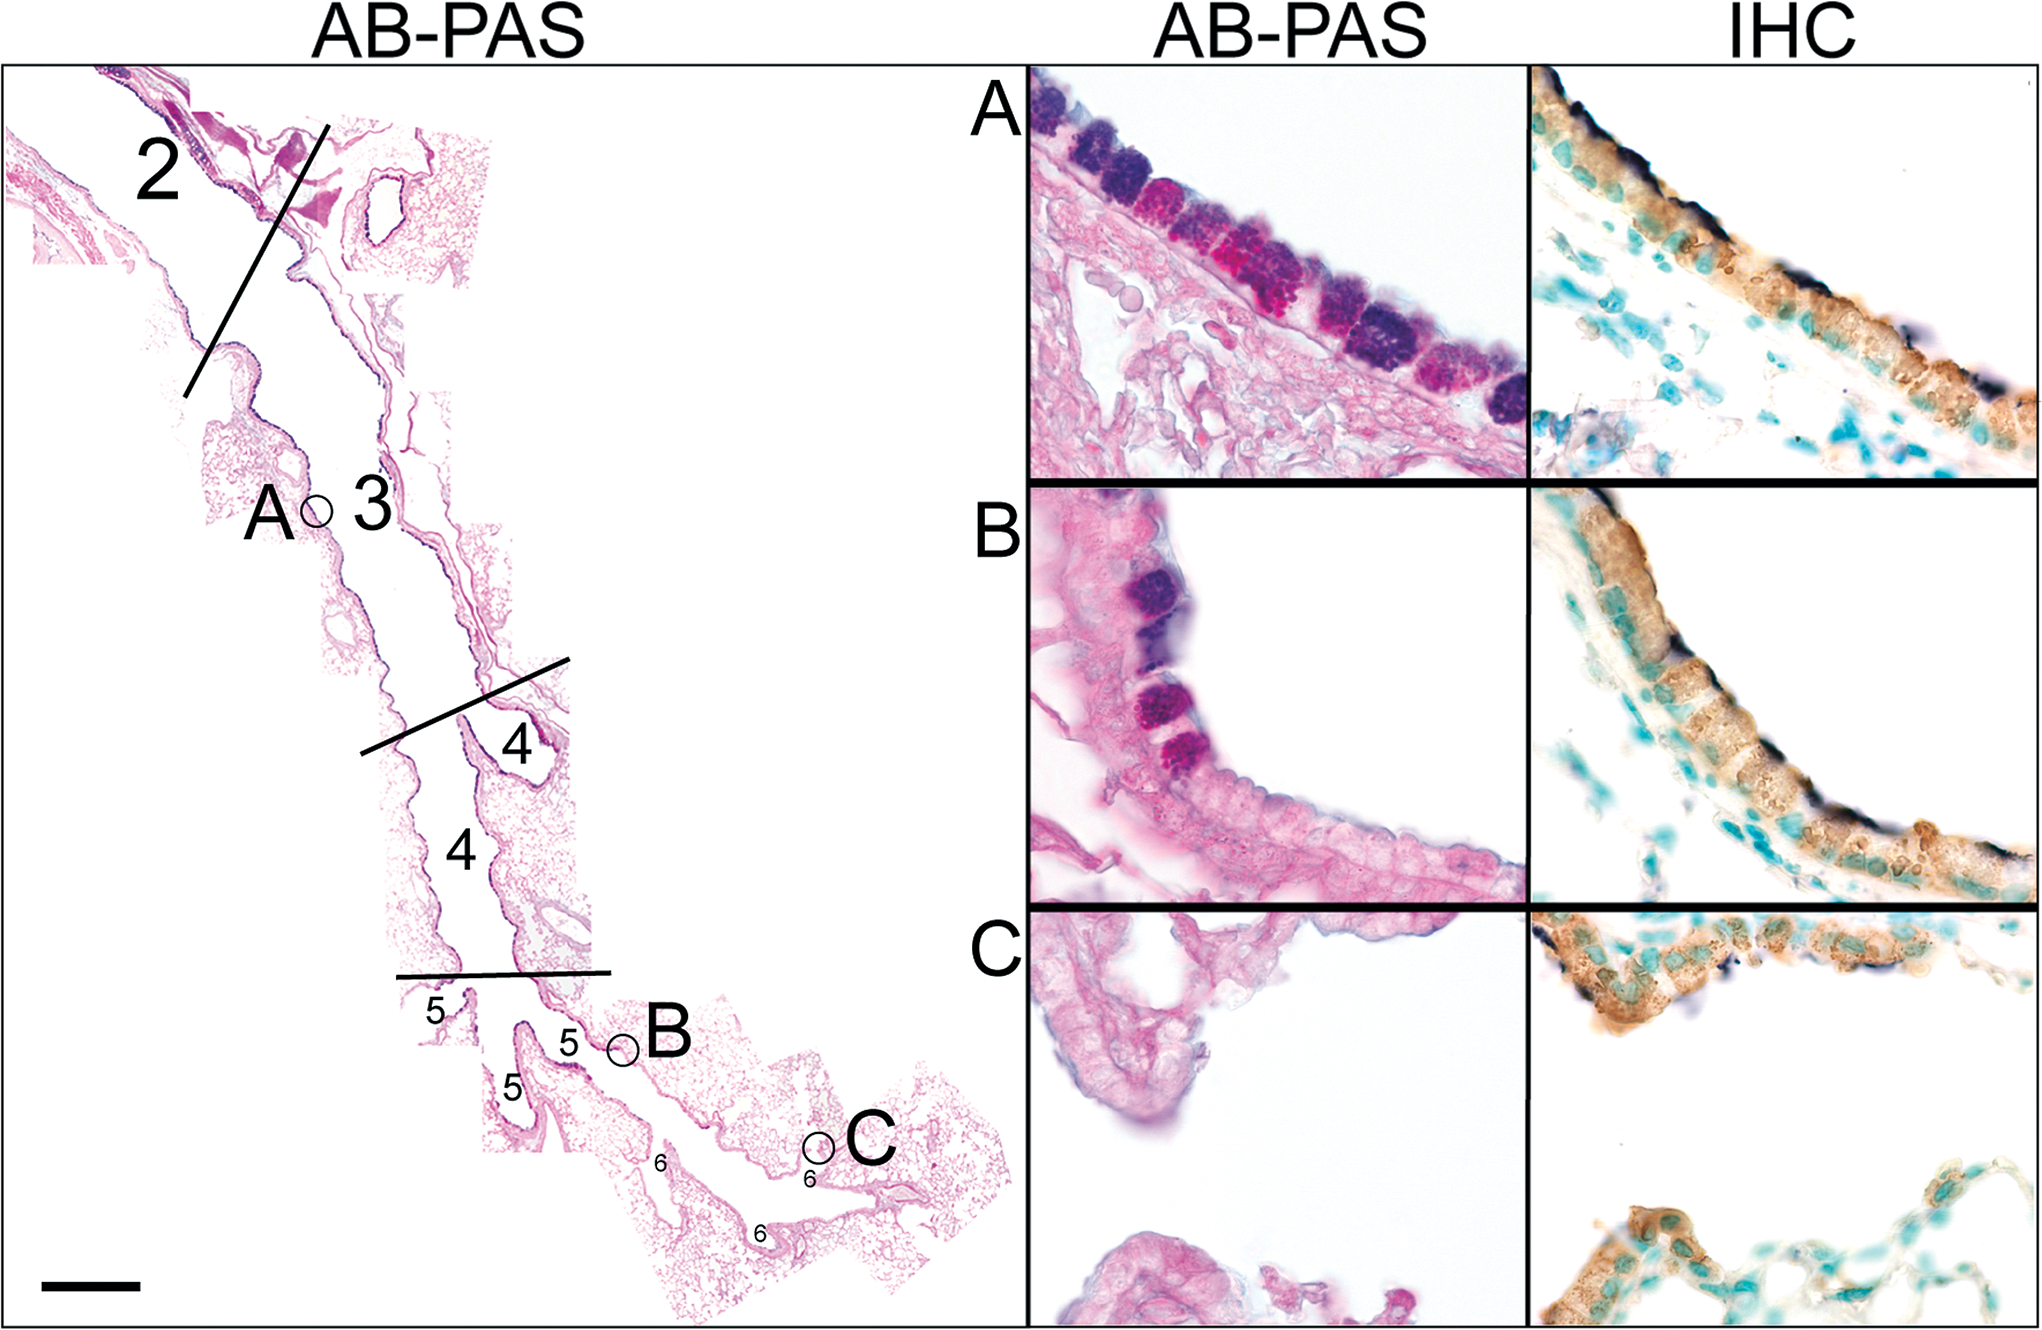
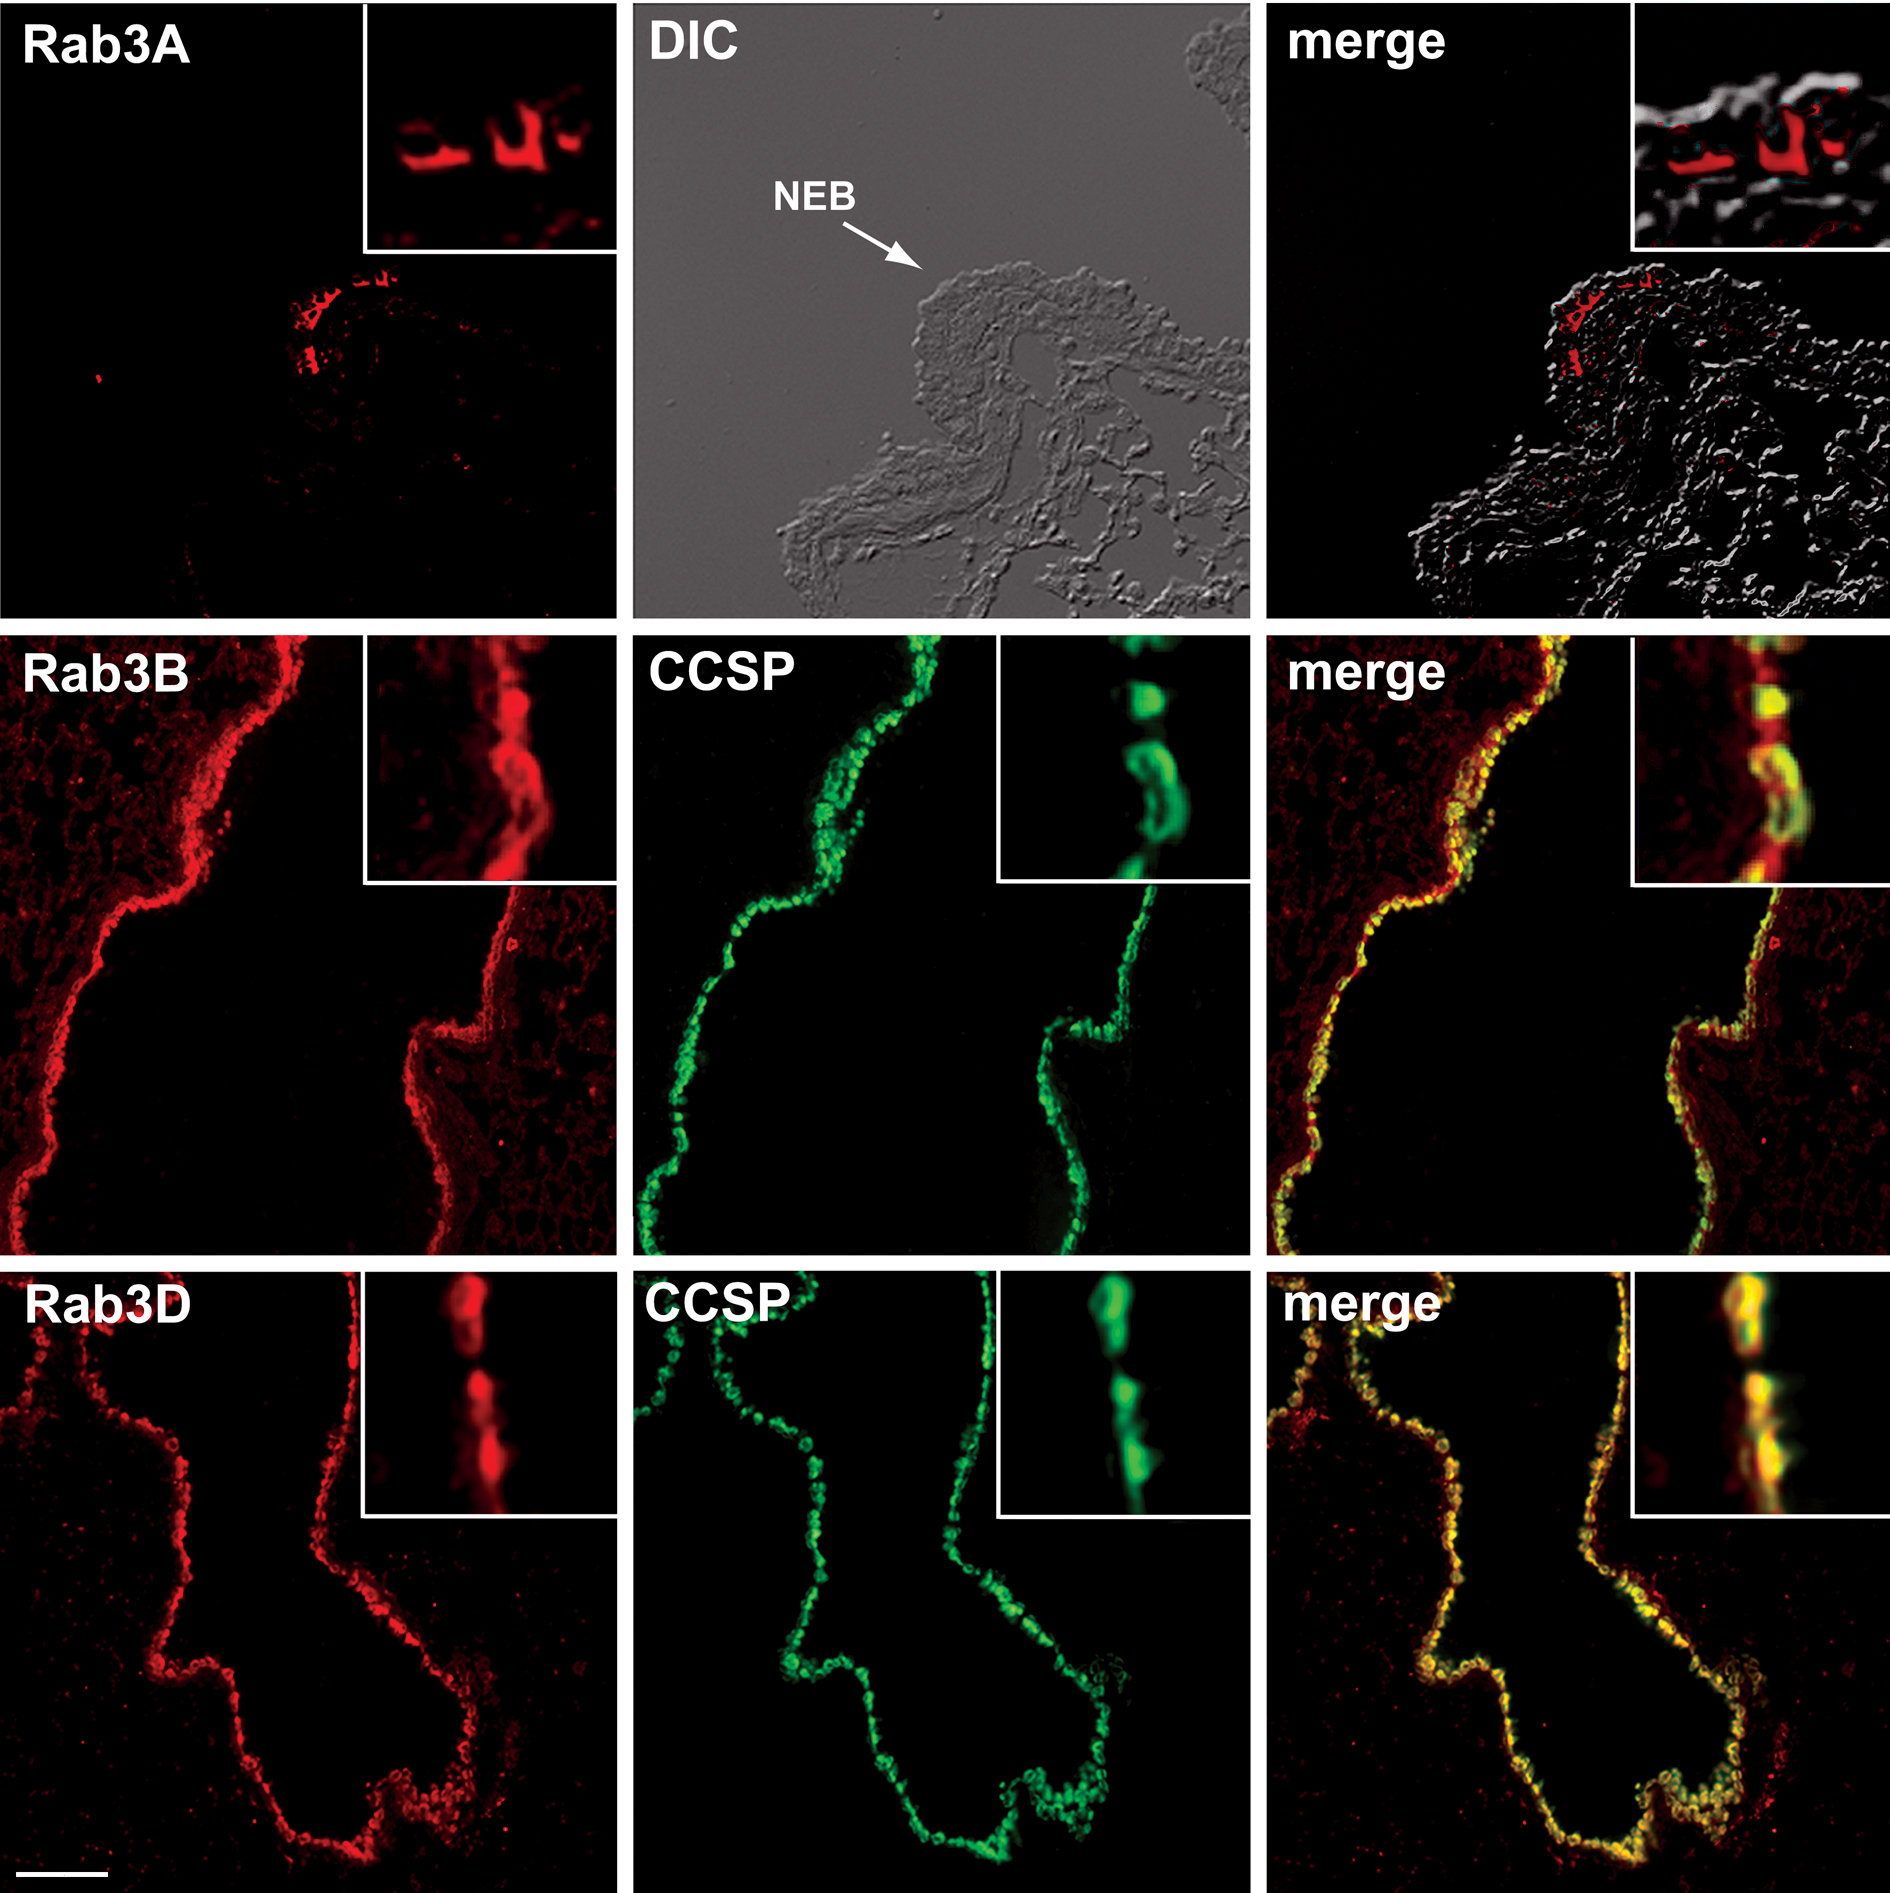
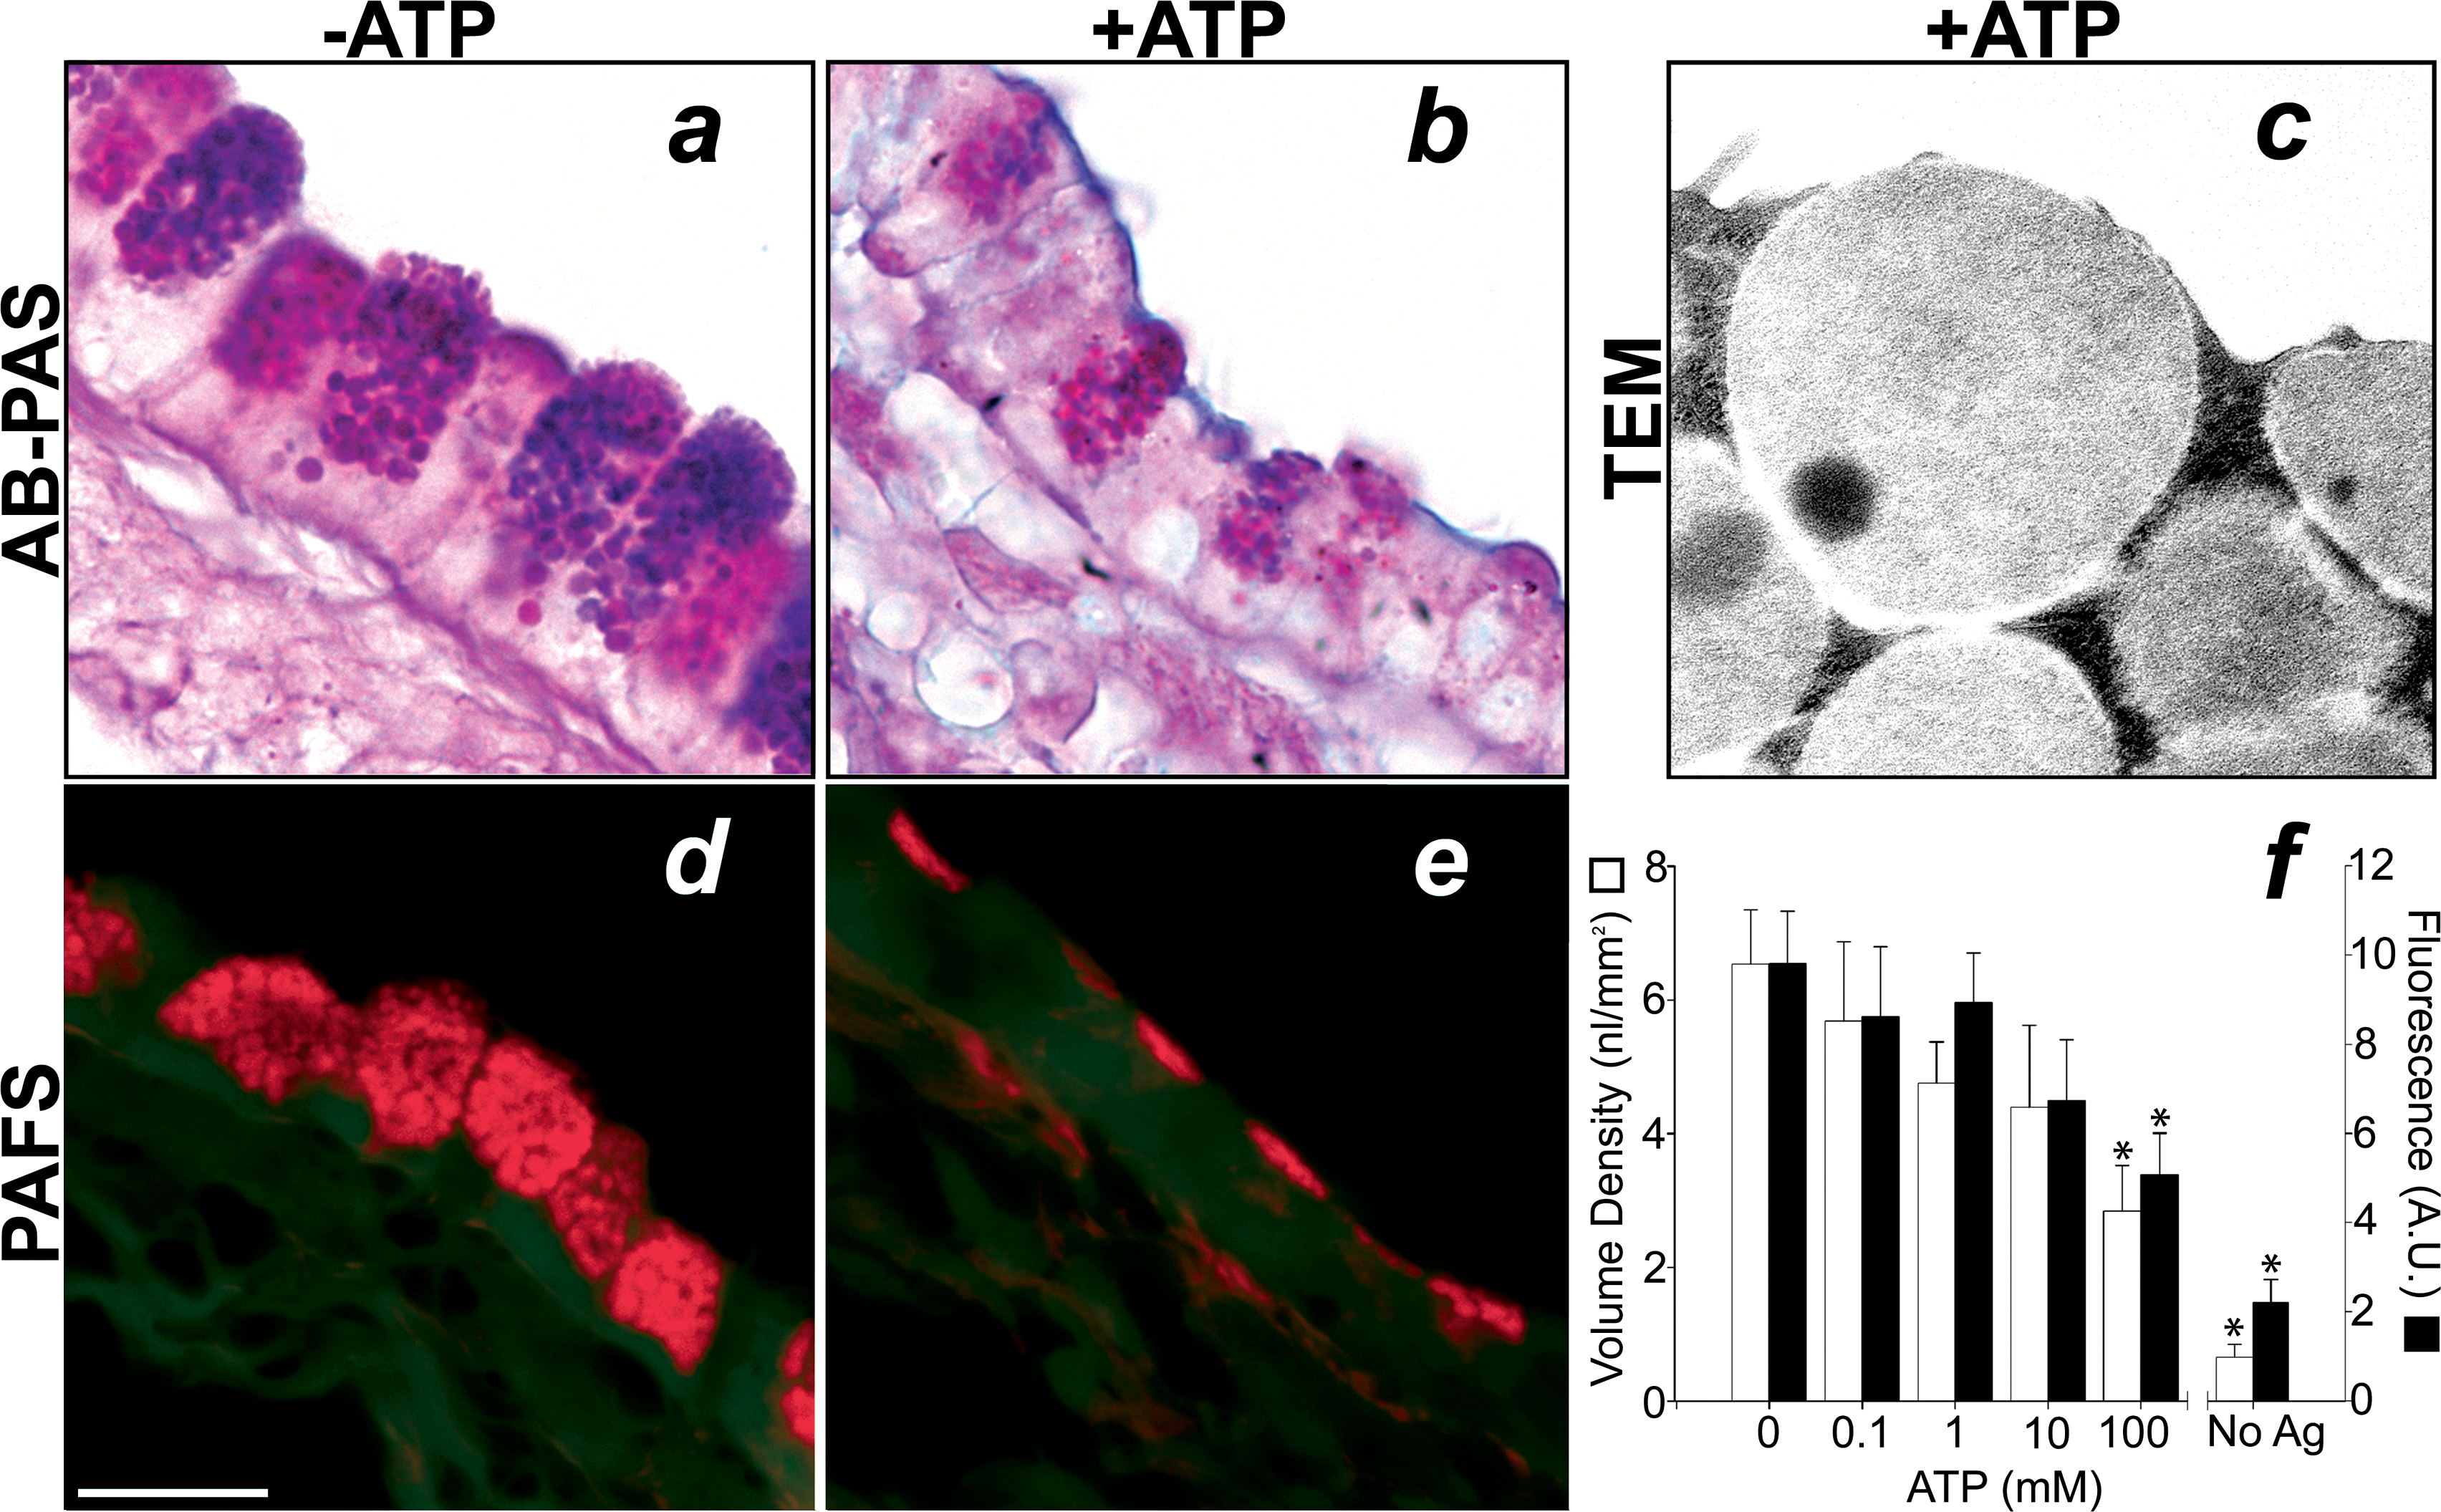
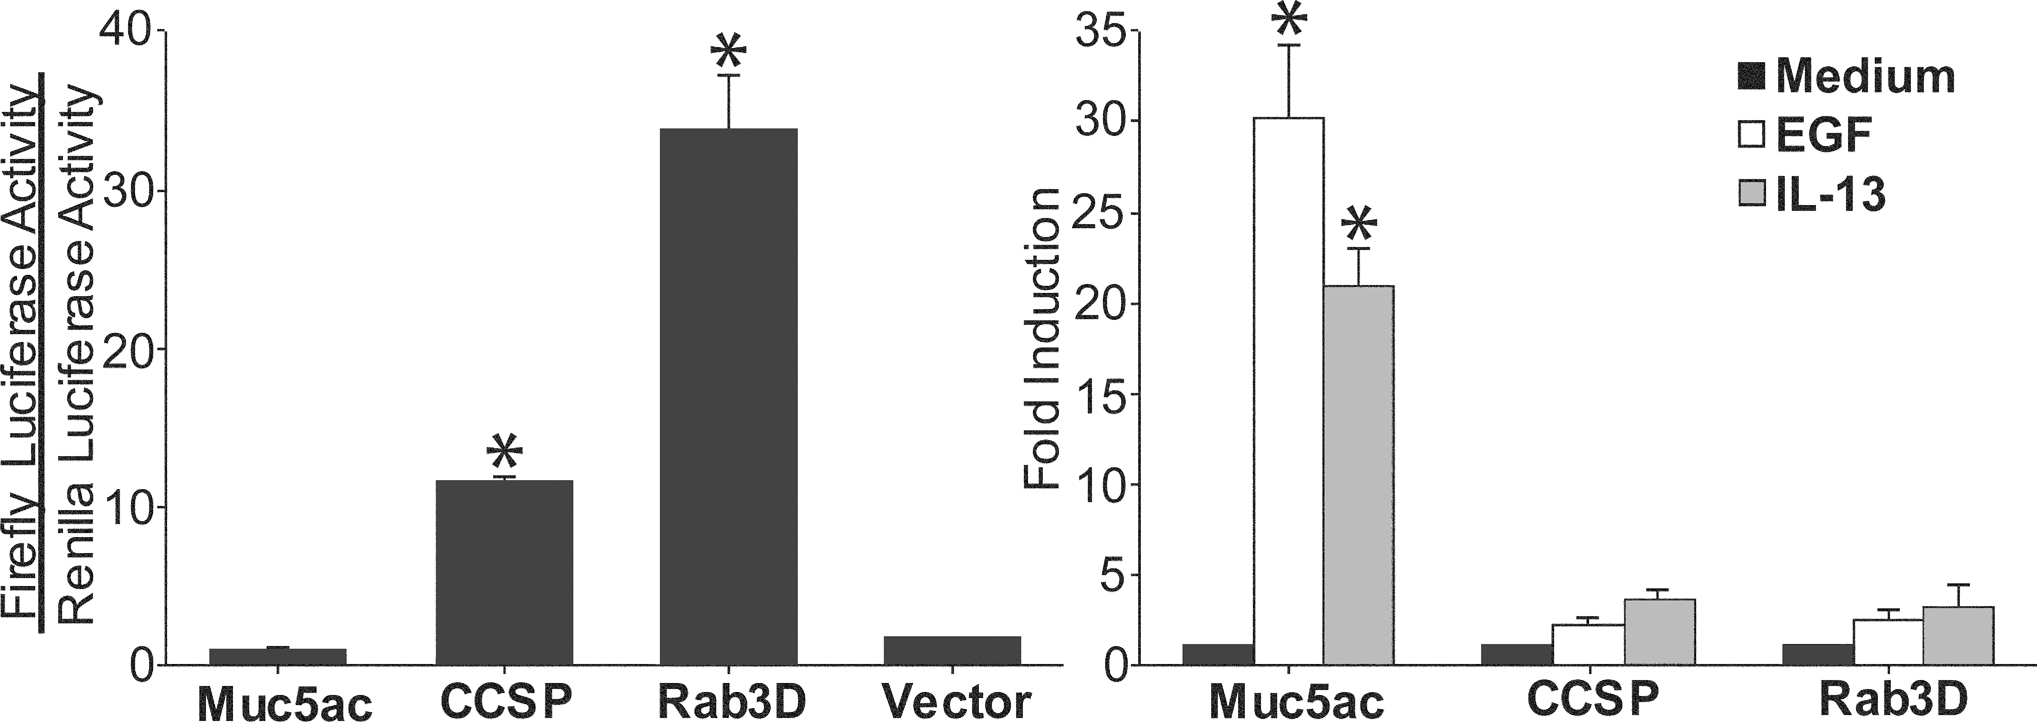
Airway mucus hypersecretion is a prominent feature of many obstructive lung diseases. We thus determined the ontogeny and exocytic phenotype of mouse airway mucous cells. In naive mice, ciliated (approximately 40%) and nonciliated (approximately 60%) epithelial cells line the airways, and > 95% of the nonciliated cells are Clara cells that contain Clara cell secretory protein (CCSP). Mucous cells comprise < 5% of the nonciliated cells. After sensitization and a single aerosol antigen challenge, alcian blue-periodic acid Schiff's positive mucous cell numbers increase dramatically, appearing 6 h after challenge (21% of nonciliated/nonbasal cells), peaking from Days 1-7 (99%), and persisting at Day 28 (65%). Throughout the induction and resolution of mucous metaplasia, ciliated and Clara cell numbers identified immunohistochemically change only slightly. Intracellular mucin content peaks at Day 7, and mucin expression is limited specifically to a Clara cell subset in airway generations 2-4 that continue to express CCSP. Functionally, Clara cells are secretory cells that express the regulated exocytic marker Rab3D and, in antigen-challenged mice, rapidly secrete mucin in response to inhaled ATP in a dose-dependent manner. Thus, Clara cells show great plasticity in structure and secretory products, yet have molecular and functional continuity in their identity as specialized apical secretory cells.


Figures

Figure 1.
Figure 1.
Antigen challenge causes marked structural changes in mouse airway epithelium. Left. The airway epithelium of saline challenged mice contains little or no AB-PAS positive mucin granules in the surface airway epithelium seen by light microscopy (a). By TEM there is an abundance of smooth endoplasmic reticulum (sER), mitochondria (Mito), and small electron dense apical secretory granules (SG) in the majority of non-ciliated surface epithelial cells in unchallenged animals (c & e). Right. Three days after antigen exposure, the airways demonstrate a marked increase in dark AB-PAS cytoplasmic staining (b) specifically within apical secretory granules (b inset). There is also a change in the ultrastructure of bronchial airway secretory epithelial cells indicative of the mucous phenotype (d). The cytoplasm of mucous cells contain more SG’s that are more electron lucent and often also contain electron dense cores (d). There is also a greater abundance of rough endoplasmic reticulum (rER) and decrease in sER in mucous cells (f). In brightfield images, the scale bar is 120 μm at low magnification and 25 μm at high magnification. Photomicrographs are representative of 5–6 animals per group. In TEM images, scale bar is 1 μm at low magnification and 150 nm at high magnification. Electron micrographs are representative of 4 mice per group.
Figure 2.
Figure 2.
Antigen challenge causes a transient increase in mucin content in the airways with little alteration in the distribution of Clara and ciliated cells. In antigen challenged mice, the number of AB-PAS positive cells increases significantly 1 day after antigen challenge, peaks at day 7 and partially resolves at days 21–28 (top graph). Immunohistochemical staining (IHC column) of CCSP positive Clara cells (CCSP positive) reveals small but significant increases at day 3 and day 21 (middle graph). There are no significant changes in the numbers of ciliated cells (acetylated tubulin positive) throughout the timecourse (IHC column & lower graph). Hematoxylin & eosin (H & E) staining shows submucosal inflammation occurring during the period of increase mucin production (days 1–21). Three to six animals were used for each time point except for 0.25 days (n=2). * indicates statistically significant difference from control, and # signifies statistically significant difference from day 7. Scale bar is 50 μm.
Figure 3.
Figure 3.
Mucin and CCSP content both increase during allergic airway inflammation. Tissue sections from antigen challenged mice were stained using a periodic acid fluorescent Schiff (PAFS) method (left panels). Mucin content increases as early as 6 h (0.25 days) following antigen challenge, is significantly increased 1 day following antigen challenge, and is maximal at 1 week (right, upper panel). Mucin content decreases significantly from peak levels 14–28 days following antigen exposure (right, upper panel). CCSP content of the lung was measured by Western blotting. CCSP is produced constitutively in the lungs of control mice (right, middle panel). The amount of CCSP increases at days 3–14 and returns to baseline at day 21. There was also an increase in the thickness of the airway epithelium that peaked at day 7 (right, lower panel). While this increase was not statistically significant, the decrease in thickness (seen coincidentally with decreasing mucin and CCSP levels) was significantly lower than unchallenged mice (day 28) and day 7 mice (days 28 & 90). Three to six animals were used for each time point except for 0.25 days (n=2). * indicates statistically significant difference from control, and # signifies statistically significant difference from day 7.
Figure 4.
Figure 4.
Mucin is produced by Clara cells in antigen challenged mice. Top. Airways from antigen challenged mice were stained immunohistochemically for CCSP and counterstained with either PAS (right) or alcian blue to stain acidic and sulfated mucins (left) to stain neutral mucins. In antigen challenged mice, alcian blue or PAS mucin granule staining colocalizes exclusively to cells immunoabeled positively for CCSP. Bottom. CCSP and mucin are packaged in the same secretory granules. Colocalization of mucin (red PAFS staining) and CCSP (blue CCSP immunolabeling) was determined by deconvolution microscopy in 0.2 μm optical planes. Pink in the merged image demonstrates colocalization of CCSP and PAFS within apical secretory granules. Scale bar is 10 μm in PAS stained images and 6 μm in alcian blue and PAFS stained images.
Figure 5.
Figure 5.
Mucin production is restricted to proximal airway Clara cells. Left. Numbers represent specific airway generation starting from the trachea: 1= trachea (not shown), 2=mainstem bronchus, 3=proximal intrapulmonary axial bronchus, 4=distal intrapulmonary axial bronchus, 5=minor daughter bronchiole, 6=terminal bronchiole, 7=alveolar duct (not labeled). Cells containing AB-PAS positive mucin granules can be seen throughout the first four airway generations in antigen challenged mice. The proximal portion of the fifth airway generation contains many mucous cells, but only an occasional mucous cell is present in the distal portion of this airway generation. From the sixth airway generation to the alveolar ducts no mucin producing cells are present. Right. High magnification of AB-PAS stained airways marked in left panel and immunohistochemical labeling of Clara cells (IHC) in adjacent consecutive sections. A. AB-PAS and CCSP positive cells are found ubiquitously in the proximal intrapulmonary airways of antigen challenged mice (generations 3 & 4). B. Airway generation five marks a transitional zone that is lined by Clara cells (right panel), but AB-PAS positive mucous cells are only present in the proximal region (left panel). C. No mucous cells are present in terminal bronchiole and alveolar duct Clara cells. Scale bar is 50 μm in low magnification composite image and 5 μm in high magnification images.
Figure 6.
Figure 6.
Clara cells express components of the regulated exocytic machinery. Airways from unchallenged mice were labeled immunohistochemically for expression of Rab3 isoforms (red) and for CCSP (green). Top. Rab3A (red) localizes to the basolateral surfaces of the cells located in a neuroendocrine body (NEB). Middle. Rab3B in the bronchial airways localizes to CCSP expressing Clara cells (yellow in merged image) and is also found cells that do not contain CCSP (red in merged image). Bottom. In the bronchial airways, Rab3D is expressed only by Clara cells (yellow in merged image). Scale bar represents 50 μm (top row) and 100 μm (middle and bottom rows). Data are representative of experiments performed in 3 animals.
Figure 7.
Figure 7.
Mucin is secreted from airway epithelial cells in a ligand-regulated manner. In mice 3 days after antigen exposure, increasing concentrations of aerosolized ATP (0.1–100 mM, 5 min) cause a dose dependent decrease in AB-PAS and PAFS staining. Top. In the absence of an ATP aerosol, mucous cells in antigen challenged mice contain large granular stores of AB-PAS positive mucin (a). Exposure of mice to ATP (100 mM, 5 min) causes an acute decrease in intracellular AB-PAS positive mucin stores (b). In mice euthanized immediately after ATP inhalation secretory granule fusion events are frequently observed (c). Bottom. The degree of ATP-induced secretion was measured in PAFS stained sections from antigen challenged mice that received aerosolized ATP (d) compared to animals that received aerosolized saline alone (e). The dose dependence of ATP-stimulated mucin secretion was quantified using volume density measurements (open bars) and fluorescence quantitation (closed bars) in PAFS stained sections (f). Scale bar is 10 μm in a, b, d, and e and 250 nm in c. * indicates statistically significant difference from antigen challenged mice not treated with ATP aerosol. Data from unchallenged mice are the same as in figure 4 (note different scale).
Figure 8.
Figure 8.
Cytokine induction of secretory genes in Clara cells. Reporter constructs containing the firefly luciferase cDNA under the control of either the mouse Muc5ac, CCSP, or Rab3D promoters were co-transfected into mtCC1–2 cells with the HSV-TK Renilla luciferase control vector. Left. The CCSP and Rab3D promoters, but not the Muc5ac promoter or the promoterless firefly luciferase vector (pGL3 Basic), are constitutively active under resting conditions. * indicates statistically significant difference from Muc5ac and pGL3 Basic transfected cells. Right. Stimulation of mtCC1–2 cells for 24 h with IL-13 (100 ng/ml) or EGF (100 ng/ml) induces Muc5ac promoter activation. * indicates statistically significant difference from unstimulated Muc5ac promoter transfected cells.

Similar articles

Cited by

References

    1. Hogg JC, MACKLEM PT, and Thurlbeck WM Site and Nature of Airway Obstruction in Chronic Obstructive Lung Disease. New England Journal of Medicine 1968;20;278(25):1355–60. - PubMed
    1. Dunnill MS The Pathology of Asthma, With Special Reference to Changes in the Bronchial Mucosa. J.Clin.Pathol. 1960;13:27–33. - PMC - PubMed
    1. Huber HL and Koessler KK The Pathology of Bronchial Asthma. Arch Intern Med 1922;30:689–760.
    1. Bedrossian CW, Greenberg SD, Singer DB, Hansen JJ, and Rosenberg HS The Lung in Cystic Fibrosis. A Quantitative Study Including Prevalence of Pathologic Findings Among Different Age Groups. Hum.Pathol. 1976;7(2):195–204. - PubMed
    1. Sethi S, Evans N, Grant BJ, and Murphy TF New Strains of Bacteria and Exacerbations of Chronic Obstructive Pulmonary Disease. New England Journal of Medicine August-15-2002;347(7):465–71. - PubMed

Publication types

MeSH terms