. 2004 Jul 1;297(1):68-81.
doi: 10.1016/j.yexcr.2004.02.017.

Retinoic acid regulates cell cycle progression and cell differentiation in human monocytic THP-1 cells

Affiliations

Retinoic acid regulates cell cycle progression and cell differentiation in human monocytic THP-1 cells

Qiuyan Chen et al. Exp Cell Res. .

Abstract

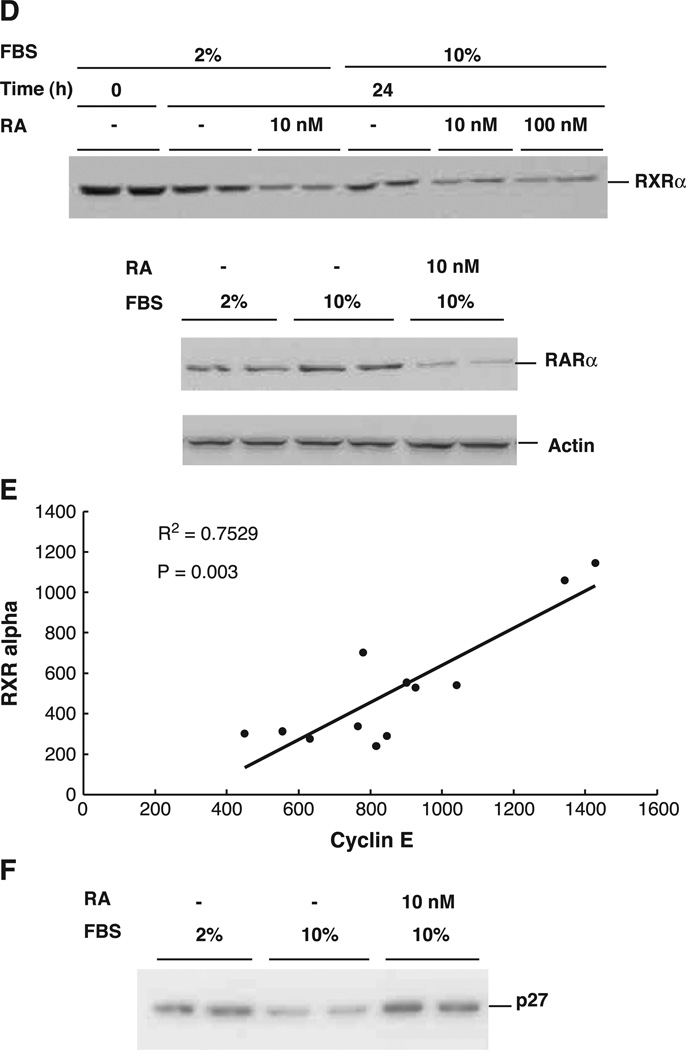
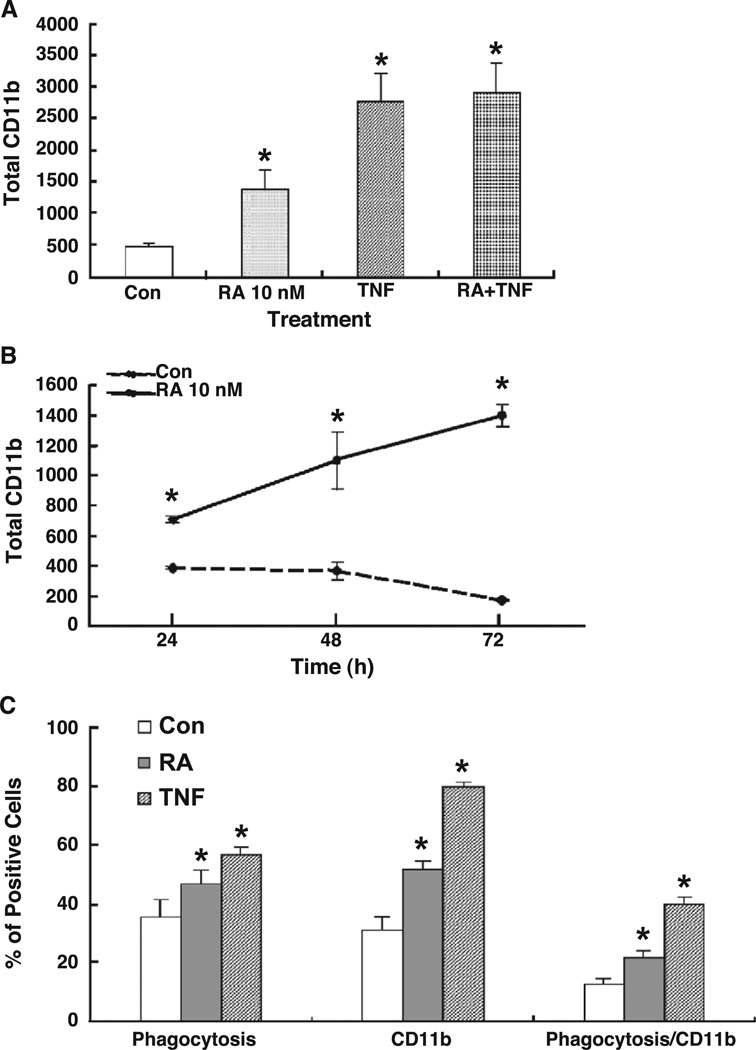
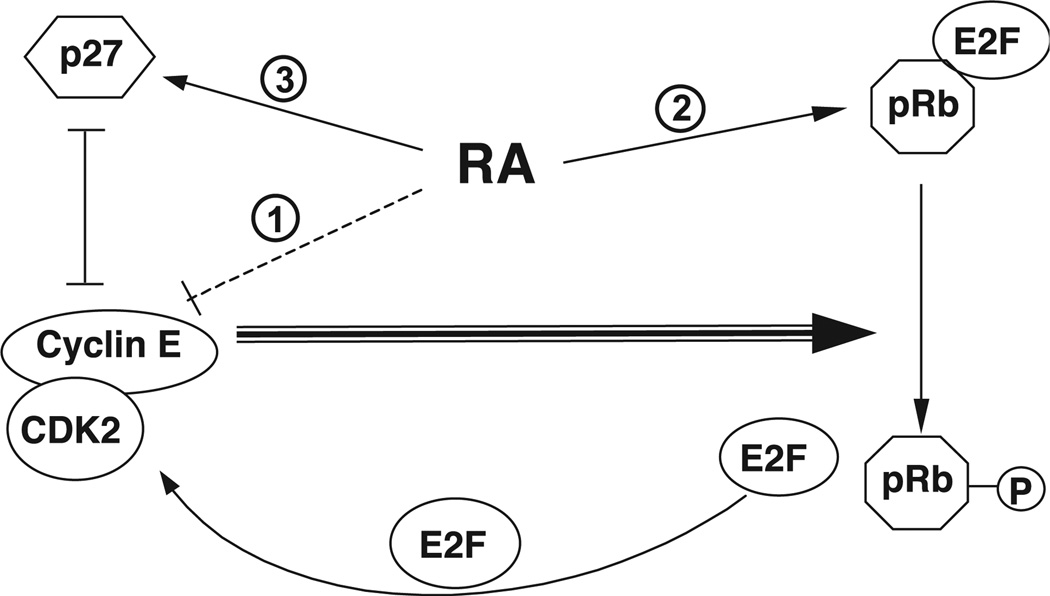
All-trans-retinoic acid (RA), a natural metabolite of retinol, carries out most of the biological activities of vitamin A and is required for normal growth, cell differentiation, and immune functions. In the present studies, THP-1 human monocytes were used to investigate the mechanisms by which RA may regulate progression through the G1/S phase of the cell cycle. Physiological concentrations of all-trans-RA reduced the levels of cyclin E mRNA by 6 h and reduced cyclin E protein in a dose- and time-dependent manner. Similar reductions were observed for the retinoic acid receptor RARalpha and RXRalpha proteins. Concomitantly, RA increased the level of the cyclin-dependent kinase inhibitor p27 (Kip-1). The levels of retinoblastoma mRNA and protein (pRb) were also increased, while the proportion of hyperphosphorylated (phosphoserine 807/811) pRb was markedly reduced. Overall, RA increased the functionality of pRb as an inhibitor of cell cycle progression. Furthermore, RA reduced the binding activity of the transcription factor E2F to its core DNA element. Retinoic acid-induced changes in cell cycle-related proteins occurred in 4-6 h, including reduced cyclin E expression in bromodeoxyuridine (BrdU)-labeled cells, before the onset of cell differentiation as indicated by an increase in the percentage of G1 phase cells and a reduction in S phase cells at 24 h. The expression of CD11b, a cell surface marker of macrophage-like differentiation was increased by RA, as was phagocytic activity. The multiple effects of RA on cell cycle progression may help to explain its well-documented ability to induce the differentiation of THP-1 cells, and thereby to enhance macrophage-like immune functions.


Figures

Fig. 1
Fig. 1
Regulation of cyclin E gene expression in THP-1 cells by retinoic acid. THP-1 cells were plated in RPMI 1640 medium with 5% serum for 24 h and then with 2% FBS for another 24 h. Serum was added to cells at a final concentration of 10% and RA was added to cells at the indicated concentrations. Total RNA was isolated at the end of each treatment and subjected to RT-PCR analysis. (A) Expression level of the cyclin E gene in the absence or presence of RA at different concentrations for 24 h. The level is represented by the ratio of treated cells over the control without RA. (B) Expression of cyclin E in the presence of RA for different times. The numbers shown in graphs A and B are the mean ± SD of three independent experiments. (C) Western blot analysis showing the levels of cyclin E in the presence (10 nM) and absence of RA. The image represents one of three independent experiments performed in duplicate. Same samples were also subjected to the Western blot analysis with anti-actin antibody and the result is shown underneath. (D) Western blot analysis of the same THP-1 cell protein lysates as described in (C) using antibodies specific to RXRα and RARα. (E) Graph showing the correlation between the protein levels of cyclin E and RXRα, both regulated by RA. The axes are arbitrary density units. (F) Western blot analysis of p27 protein in the presence and absence of RA. The actin bands were shown underneath as internal control.
Fig. 1
Fig. 1
Regulation of cyclin E gene expression in THP-1 cells by retinoic acid. THP-1 cells were plated in RPMI 1640 medium with 5% serum for 24 h and then with 2% FBS for another 24 h. Serum was added to cells at a final concentration of 10% and RA was added to cells at the indicated concentrations. Total RNA was isolated at the end of each treatment and subjected to RT-PCR analysis. (A) Expression level of the cyclin E gene in the absence or presence of RA at different concentrations for 24 h. The level is represented by the ratio of treated cells over the control without RA. (B) Expression of cyclin E in the presence of RA for different times. The numbers shown in graphs A and B are the mean ± SD of three independent experiments. (C) Western blot analysis showing the levels of cyclin E in the presence (10 nM) and absence of RA. The image represents one of three independent experiments performed in duplicate. Same samples were also subjected to the Western blot analysis with anti-actin antibody and the result is shown underneath. (D) Western blot analysis of the same THP-1 cell protein lysates as described in (C) using antibodies specific to RXRα and RARα. (E) Graph showing the correlation between the protein levels of cyclin E and RXRα, both regulated by RA. The axes are arbitrary density units. (F) Western blot analysis of p27 protein in the presence and absence of RA. The actin bands were shown underneath as internal control.
Fig. 2
Fig. 2
Regulation of retinoblastoma gene expression and protein phosphorylation by retinoic acid in THP-1 cells. THP-1 cells were treated as stated above, cellular protein was subjected to Western blot analysis. (A) A representative Western blot analysis showing the expression levels of pRb and pRb phosphorylated at position S807/811. Fifty micrograms of protein from THP-1 cell treated with/without RA was subjected to Western blot analysis. These images represent one of three independent experiments with consistent results. (B) Graph illustrating the ratio of total pRb protein compared to phosphorylated pRb, normalized to the ratio in control cells in medium with 2% FBS, at 24 h of incubation, based on data shown in (A).
Fig. 3
Fig. 3
Regulation of E2F DNA binding activity by retinoic acid. THP-1 cells were treated with low serum conditioning and medium was replaced with 2% or 10% serum in the presence or absence of RA for 24 h. Nuclear protein was isolated and tested for binding activity with the 32P-labeled E2F consensus element. The left panel is the EMSA showing the formation of E2F protein–DNA binding complex, which appears as a diffuse complex, probably due to multiple interacting components. A 25-fold excess unlabeled E2F or mutated E2F DNA elements were used in the competition assay with the nuclear protein from 10% FBS-treated cells to demonstrate the specificity of the complex. The right panel shows the complex formed on a 32P-labeled Sp-1 consensus element incubated with the same nuclear protein extracts used in the left panel.
Fig. 4
Fig. 4
Regulation of THP-1 cell cycle progression by retinoic acid. THP-1 cells were treated as stated in Fig. 3. Cells were stained with propidium iodide/RNase A solution and the cell cycle profile was assessed by determining DNA content per cell. (A) THP-1 cell distribution during the cell cycle in the presence of RA at different concentrations. Cells treated with RA for 24 h are illustrated. Mean ± SD of 4 experiments conducted in triplicate. (B) The percentage of S phase cells in the presence and absence of 100 nM RA. The values shown in the graph are the mean ± SD of four independent experiments performed in triplicate; * P < 0.05. (C) [3H]Thymidine incorporation by THP-1 cells. After the addition of RA and 10% serum for 24 h, cells were pulse labeled with [3H]thymidine for the last 4 h and then harvested for scintillation counting. The reduction due to RA was calculated relative to the results for cells in medium with 10% FBS, set as 1.00. N = 5 samples per treatment; * P < 0.05. (D and E) Regulation of cellular cyclin E level and cell cycle progression by RA. THP-1 cells cultured in medium with 10% FBS (unsynchronized cells) were pulsed with BrdU for 1 h. Cells were then washed and cultured with and without RA and harvested after 4 and 24 h of RA treatment. Intracellular cyclin E protein (fluorescence) in total cells and BrdU-positive cells at 4 h (D), and the cell cycle profile (% of G1 and S-phase cells) (E), were determined by flow cytometry. Data represent two independent experiments with triplicate samples (mean ± SD). * P < 0.01.
Fig. 5
Fig. 5
CD11b expression level and phagocytosis activity in retinoic acid-treated THP-1 cells. THP-1 cells were plated in low serum condition and then treated with and without RA (10 nM) in the present of 10% FBS. (A) CD11b expression levels in THP-1 cells. Cells treated with and without RA for 48 h were subjected to flow cytometry after staining with an anti-CD11b antibody. The total expression level was calculated by multiplying the percentage of CD11b-positive cells by the average fluorescence intensity per cell. (B) CD11b level in THP-1 cells after treated for 24 to 72 h. (C) Phagocytic activity of RA-treated THP-1 cells. THP-1 cells were treated with or without RA for the times indicated before fluorescein-labeled E. coli bioparticles were added for an additional 2 h. After harvesting, the cells were subjected to CD11b staining and then analyzed by flow cytometry. The values shown are the mean ± SD of three independent experiments performed in triplicate. * P < 0.05.
Fig. 6
Fig. 6
A working model of retinoic acid-induced regulation of cell cycle progression in THP-1 cells. RA is proposed to regulate the differentiation of THP-1 cells through multiple pathways: (1) RA may reduce in the level of cyclin E, affecting the formation of cyclin E/CDK2 complex, and in turn reduces pRb phosphorylation; (2) RA may induce the expression of pRb mRNA and protein, enhancing the functionality of pRb in its negative regulation of cell growth; (3) RA may also affect the level of p27 protein, possibly directly or possibly as the indirect result of the suppression of cyclin E/CDK activity by RA. The combined results of these multiple actions markedly increase the functionality of pRb (increased ratio of Rb protein to hyperphosphorylated Rb as shown in Fig. 2), and reduces the rate of cell progression from the G1 to the S phase of the cell cycle.

Similar articles

Cited by

References

    1. Soderlund MB, Sjoberg A, Svard G, Fex G, Nilsson-Ehle P. Biological variation of retinoids in man. Scand. J. Clin. Lab. Invest. 2002;62:511–519. - PubMed
    1. Altucci L, Gronemeyer H. Nuclear receptors in cell life and death. Trends Endocrinol. Metab. 2001;12:460–468. - PubMed
    1. Wei LN. Retinoid receptors and their coregulators. Annu. Rev. Pharmacol. Toxicol. 2003;43:47–72. - PubMed
    1. Zile MH, Cullum ME, Roltsch IA, DeHoog JV, Welsch CW. Effect of moderate vitamin A supplementation and lack of dietary vitamin A on the development of mammary tumors in female rats treated with low carcinogenic dose levels of 7,12-dimethylbenz(a)anthracene. Cancer Res. 1986;46:3495–3503. - PubMed
    1. Ghosh J, Das S. A study on the effect of vitamin A deficiency and supplementation on tumorigenesis in mice. Neoplasma. 1988;35:41–49. - PubMed

Publication types

MeSH terms