Comparative Study
. 2004 Aug 1;558(Pt 3):825-39.
doi: 10.1113/jphysiol.2004.065649. Epub 2004 Jun 11.

Electrotonic coupling between stratum oriens interneurones in the intact in vitro mouse juvenile hippocampus

Affiliations
Comparative Study

Electrotonic coupling between stratum oriens interneurones in the intact in vitro mouse juvenile hippocampus

Xiao-Lei Zhang et al. J Physiol. .

Abstract

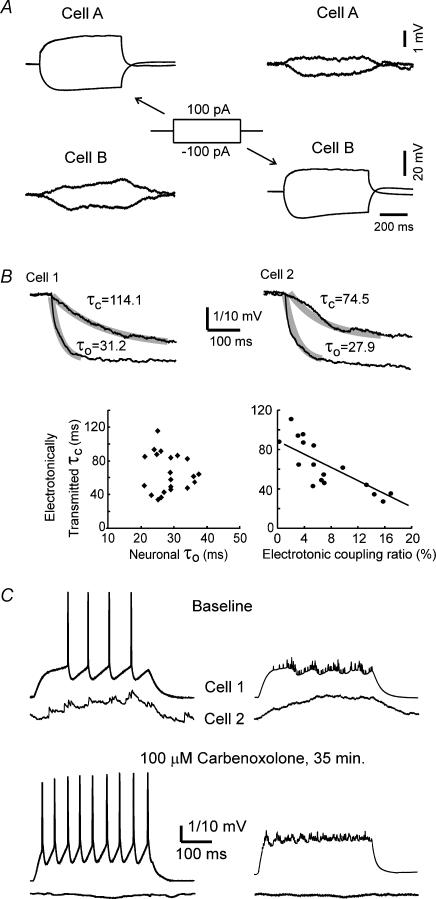
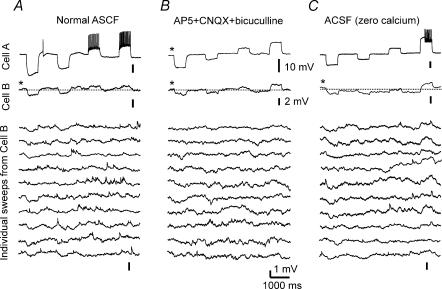
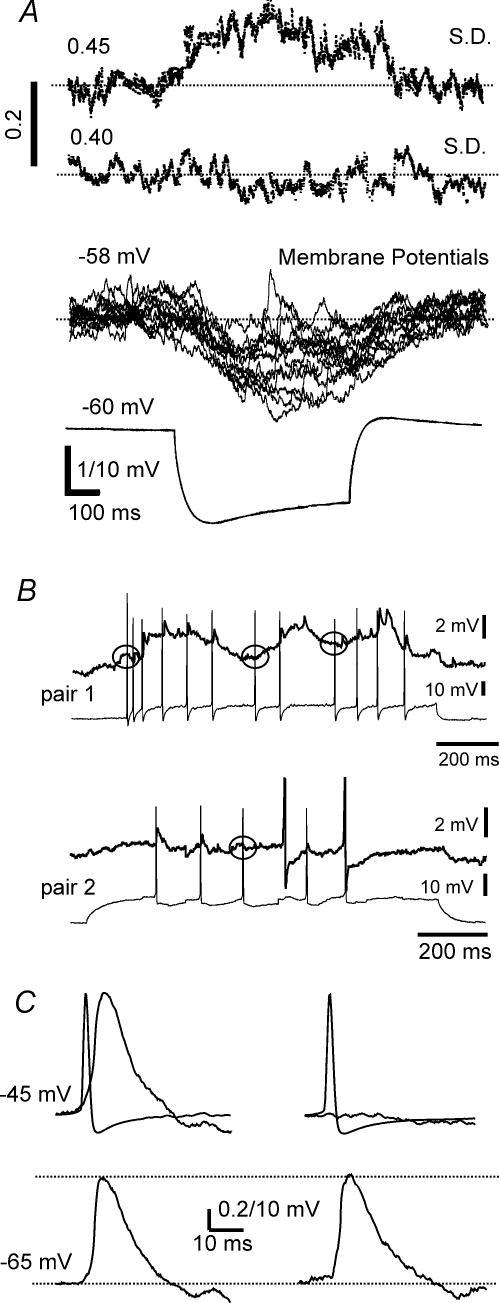
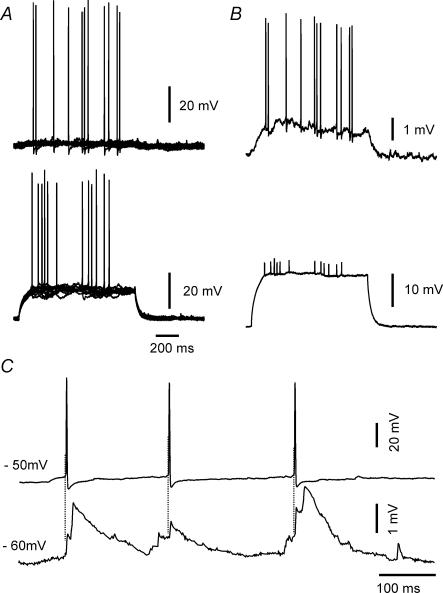
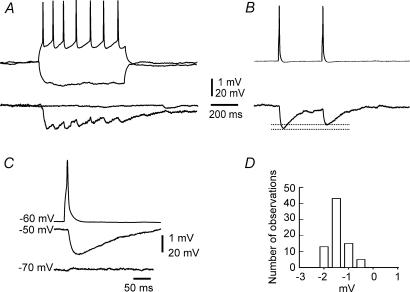
Using the isolated juvenile (7-14 days) mouse whole hippocampus preparation, which contains intact complex local circuitry, 145 dual whole cell recordings were made from stratum oriens (s.o.) interneurones under infrared microscopy. In 11.7% of paired recordings, evidence for direct electrotonic coupling between the s.o. interneurones was obtained from the response of one interneurone to a long (400-600 ms) constant current pulse passed into the coupled interneurone. When specifically orienting the dual recordings in the transectional plane of the hippocampus, 18.5% of paired recordings showed electrotonic coupling. The coupling coefficient, estimated from averaged data, was 6.9 +/- 4.7%, ranging from 1.3 to 17.6%. The time constant of the electrotonically transmitted hyperpolarization was inversely related to the coupling coefficient between the two neurones. The electrotonic responses of one neurone to constant current pulses injected into the other coupled neurone were intermittent. Spikes in one of the coupled neurones were associated with small electrotonic EPSPs (spikelets) in the other coupled neurone, in those neuronal pairs with coupling coefficients greater than 10%. Failure of spikelet production following a spike in the coupled cell occurred 5-10% of the time. Electrotonic coupling and spikelets persisted in the presence of chemical synaptic transmission blockade by CNQX, APV and bicuculline, or in zero Ca(2+) perfusate, but were abolished by carbenoxolone (100 microm), a gap junctional blocker. These data confirm the existence of electrotonic coupling between s.o. interneurones, presumably via gap junctions located in dendrites.


Figures

Figure 1
Figure 1. Evoked synaptic field responses and intracellular s.o. interneuronal responses to current injection in the whole hippocampus preparation
A, evoked field potentials in the CA1 region of the hippocampus. Field potentials were evoked by stimulating the Schaffer collateral pathway to elicit a maximal response. The numbers on the left represent the depth of recording electrode from the top of the IHP into the stratum oriens, the CA1 pyramidal layer, and below into the stratum radiatum. Note the polarity change at the CA1 pyramidal layer. B, left traces, tonic firing in s.o. interneurones. The top trace illustrates an s.o. interneurone firing tonically with little spike frequency adaptation. The lower trace is a schematic description of the depolarizing current intensity. Right trace, average of 5 APs of an s.o. interneurone. AP duration was taken at the baseline (indicated by the thin dotted line). The arrow indicates a large, fast AHP (fAHP). The amplitude of the fAHP was measured from the baseline to the maximal hyperpolarization. C, stable field responses to paired pulse stimulation. Maximal CA1 field potentials evoked by stimulating Schaffer collateral pathway were recorded at a depth of approximately 300 μm from the s.o. side of the hippocampus. The amplitude of the evoked field was measured from the maximal downward voltage deflection. Paired pulse stimuli were delivered every 30 s. The data are presented in the form of mean ±s.d. from 6 IHPs.
Figure 2
Figure 2. Electrotonic coupling between s.o. interneurones
A, injecting either depolarizing or hyperpolarizing currents into cell A causes a corresponding passive small depolarization or hyperpolarization in the electrotonically coupled cell B, as seen in the left 2 panels. Conversely, reciprocal electrotonic coupling was demonstrated when cell B was injected with depolarizing or hyperpolarizing currents and the passive voltage responses were measured in cell A (left 2 panels). All traces in A are averaged from 20 sweeps. B, the time course of the hyperpolarization from electrotonically transmitted currents is much slower than that of the hyperpolarization induced by injecting current directly into the recorded neurone. The two examples in the upper 2 panels are from coupled neurones in separate hippocampal preparations. The upper traces in each example show the averaged hyperpolarization response electrotonically transmitted from a coupled cell. The lower traces represent the averaged direct hyperpolarization measured in the current-injected cell. The thick overlapping lines are exponential decay fits for the individual lines. τ0 is the neuronal time constant, while τc is the time constant for the passive electrotonically driven hyperpolarization in the coupled cell. The neuronal time constants (τ0) did not correlate with the time constants of the electrotonically driven hyperpolarizations (τc) (lower right graph), whereas the coupling ratios correlated with the electrotonically driven time constant (τc) (lower right graph). The voltage calibration is 1 mV for the traces represented by τc, and 10 mV for the traces represented by τ0. C, carbenoxolone blocks electrotonic coupling between s.o. interneurones. Top row of traces: simultaneous whole cell recordings from two s.o. interneurones, showing electrotonic coupling between the two cells bathed in normal ACSF. Bottom row of traces: same paired recordings after the hippocampus was exposed to carbenoxolone (100 μm), a gap junctional blocker. The traces on the left show typical traces recorded simultaneously from two electrotonically coupled neurones. The traces on the right show the average of 16 sweeps. Cell 1 is the current injected cell and Cell 2 is the electrotonically coupled cell.
Figure 3
Figure 3. Intermittent weak electronic coupling between s.o. interneurones
A, the first trace (from top to bottom) represents a single sweep recorded from the current-injected interneurone. The second trace is an averaged sweep of 20 consecutive sweeps from the other coupled interneurone. Electrotonic coupling is clearly seen in this sweep. Below are shown individual sweeps from the coupled interneurone. Note that coupled responses to current injections into the other cell, into which the current pulses are injected, are partially or completely absent from some of the individual traces. B, intermittent electrotonic coupling remains when chemical neurotransmission is blocked by perfusing the hippocampus with ACSF containing CNQX (20 μm), AP5 (25 μm), and bicuculline (20 μm). The top trace represents the averaged sweep of 16 consecutive sweeps from the current-injected cell. The second trace is the average of 16 sweeps from the other coupled neurone, showing electrotonic coupling between the two cells. The lower traces are individual sweeps from this cell. The electrotonic coupling is not obvious in some sweeps. C, the hippocampus was exposed to ACSF without added Ca2+, again to block chemical synaptic transmission. The top trace is a sweep from the current injected cell. The second trace is the average of 16 sweeps from the electrotonically coupled cell. The remaining traces are individual sweeps from the electrotonically coupled cell, again showing that this electrotonic coupling is intermittent.
Figure 4
Figure 4. Increased variability of the electrotonically transmitted voltage responses in the coupled cell compared to the current injected cell
A, increased variance of passive, non-current-injected coupled neurone shown by the standard deviation of the membrane potential calculated from 16 consecutive sweeps. The upper trace represents the standard deviations of the membrane potential in the electrotonically coupled cell, while the second line illustrates those in the current injecting cell. Note the marked increased standard deviations in the upper trace during the time of the current injection into the coupled neurone The lower 2 traces are the corresponding membrane potential responses to hyperpolarizing current pulses in the coupled cells, showing increased voltage fluctuations in the passive non-current injected receiving neurone. B, spikelets could be evoked in s.o. interneurones by spikes in the electrotonically coupled cell, with intermittent failures. The spikes, shown in the lower traces of two separate examples of paired recordings of coupled neurones, evoked corresponding spikelets in the coupled cell shown at a higher gain in the upper traces. However, not all spikes elicited corresponding spikelets in the electrotonically coupled cell as denoted by circles showing absence of evoked spikelets in the electrotonically coupled cell. Pair 1 was in normal ACSF, and pair 2 was perfused with ACSF containing synaptic transmission blockers CNQX (20 μm), AP5 (25 μm) and bicuculline (20 μm). C, spikes in an s.o. interneurone evoke spikelets in the other electrotonically coupled neurone. The upper left traces are averaged data triggered by 110 spikes from the current injected cell. The averaged spike is the briefer event and the mean spikelet is a more prolonged postsynaptic potential shown at a much higher gain (0.2 mV calibration). Failures of the spike to produce a spikelet in the current receiving cell (in this example, 6 out of 110) were rejected from this average and are shown as averaged data in the left upper 2 traces. In the lower 2 traces, spike-triggered average data, each from 50 spikelets at two different membrane potentials in an s.o. interneurone, show that the peak spikelet amplitude is independent of the membrane potential. In these examples, the parental spikes are not superimposed.
Figure 5
Figure 5. Electrophysiological effects of electrotonic coupling in individual s.o. interneurones
Increased cell excitability due to electrotonic coupling. A, 12 sweeps are overlapped to show that depolarization of one interneurone increases the firing probability of the other cell. B, average of all traces, showing, at higher gain, the electrotonically mediated depolarization. C, spontaneous activity between two electrotonically coupled s.o. interneurones. The lower trace shows spontaneous EPSPs in one interneurone. Apparent spikelets, which are closely time-locked to a spike from the coupled cell, are summated onto what appears to be an underlying chemical EPSPs.
Figure 6
Figure 6. Morphology of s.o. interneurones
Horizontal 100 μm slices were made in parallel with the longitudinal axis of the hippocampus. Two successive slices are superimposed for each individual s.o. interneurone. Camera lucida drawings are made from neurobiotin-filled interneurones.
Figure 7
Figure 7. The s.o. interneurone can be coupled by chemical synapses without concomitant electrotonic coupling
A, the tonic firing of one cell causes repetitive IPSPs in the other cell, whereas a tonic hyperpolarization has no effect on the other cell. B, paired pulse depression is evoked by two action potentials separated by 240 ms, triggered at 0.5 Hz. Data are averaged from 32 sweeps. C, the reversal potential of the synaptic potential is near −70 mV (averaged from 32 sweeps). D, amplitude distribution of the IPSPs (n = 76), showing a relatively stable amplitude.

Similar articles

Cited by

References

    1. Acsady L, Gorcs TJ, Freund TF. Different populations of vasoactive intestinal polypeptide-immunoreactive interneurons are specialized to control pyramidal cells or interneurons in the hippocampus. Neuroscience. 1996;73:317–334. - PubMed
    1. Bartos M, Vida I, Frotscher M, Meyer A, Monyer H, Geiger JR, Jonas P. Fast synaptic inhibition promotes synchronized gamma oscillations in hippocampal interneuron networks. Proc Natl Acad Sci U S A. 2002;99:13222–13227. - PMC - PubMed
    1. Bennett MV. Gap junctions as electrical synapses. J Neurocytol. 1997;26:349–366. - PubMed
    1. Bennett MV. Electrical synapses, a personal perspective (or history) Brain Res Brain Res Rev. 2000a;32:16–28. - PubMed
    1. Bennett MV. Seeing is relieving: electrical synapses between visualized neurons. Nat Neurosci. 2000b;3:7–9. - PubMed

Publication types

LinkOut - more resources