Comparative Study
. 2004 Aug 1;558(Pt 3):841-55.
doi: 10.1113/jphysiol.2004.065052. Epub 2004 Jun 11.

An analysis of inhibitory junction potentials in the guinea-pig proximal colon

Affiliations
Comparative Study

An analysis of inhibitory junction potentials in the guinea-pig proximal colon

G D S Hirst et al. J Physiol. .

Abstract

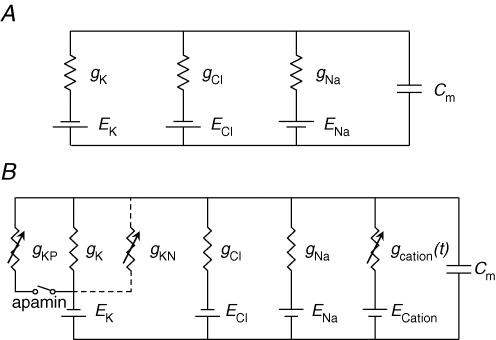
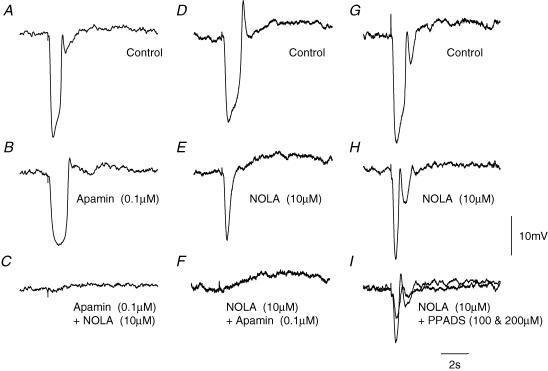
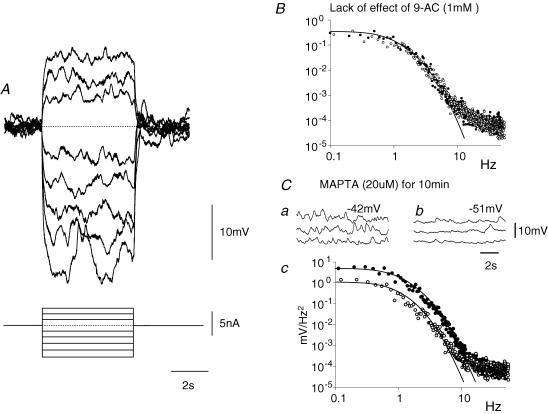
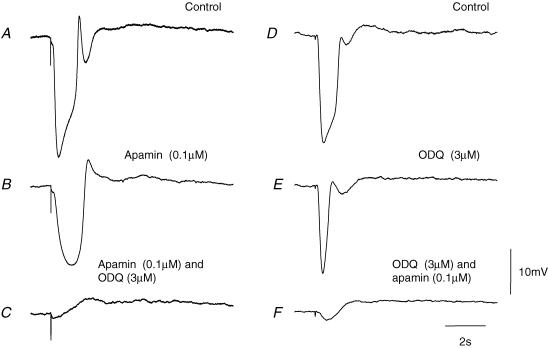
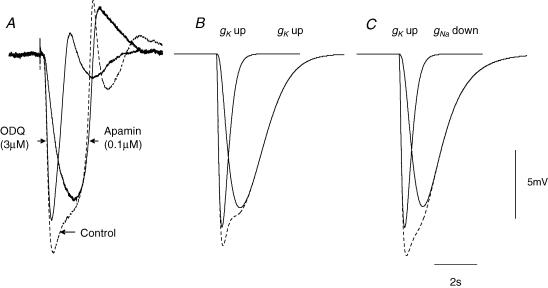
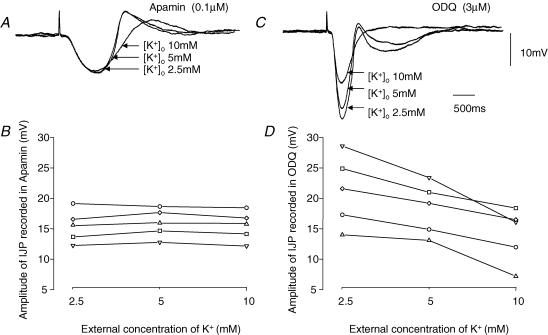
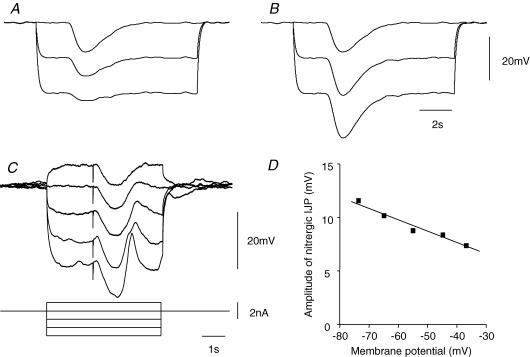
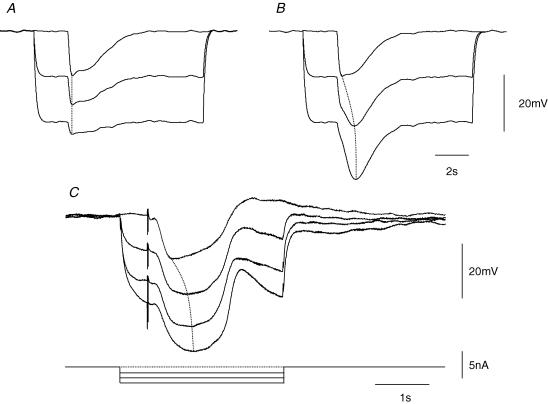
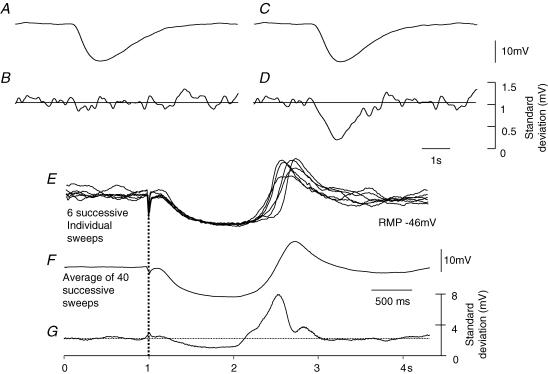
Intracellular recordings were made from either sheets or isolated bundles of the circular muscle layer of guinea-pig proximal colon and the responses evoked by stimulating inhibitory nerve fibres were analysed. Inhibitory junction potentials (IJPs), evoked by single stimuli, had two components which could be separated on their pharmacological and temporal characteristics and their voltage sensitivities. The initial component, which was abolished by apamin and reduced in amplitude by pyridoxalphosphate-6-azophenyl-2',4'-disulphonic acid (PPADS), had a brief time course: its amplitude was changed when the external concentration of potassium ions ([K+](o)) was changed. The second component of the IJP had a slower onset than the first component, was abolished by l-nitroarginine (NOLA) and oxadiazolo quinoxalin-1-one (ODQ), an inhibitor of soluble guanylate cyclase: its amplitude was little affected by changing [K+](o) and was increased when the membrane potential of the circular layer was hyperpolarized. The observations suggest that the initial component of the IJP results from the release of ATP which triggers an increase in membrane conductance to K+ and that the second component results from the release of nitric oxide which suppresses a background inward current.


Figures

Figure 1
Figure 1. Equivalent electrical circuits used to simulate the time courses of IJPs recorded from the circular layer of the proximal colon
A illustrates the simple electrical circuit used to simulate the time courses of IJPs recorded the distal colon. The early purinergic component of the IJP was modelled as a transient increase in gK whose time course of the modulation was defined as the difference between two exponential functions, raised to a power, N (eqn (1)). The nitrergic component of the IJP was modelled as an additional slower more sustained increase in gK again using eqn (1). The time course of the membrane potential change (Em) of the equivalent cell is given by eqn (2). No attempt was made to simulate the rebound depolarization that was evident in recordings of IJPs. B illustrates the electrical circuit used to simulate the time courses of IJPs when a tonic depolarization was assumed to be generated by ICCIM. This additional conductance was proposed to be dependent on an ongoing discharge of unitary conductance modulations. The purinergic K+ conductance (gKP) proposed in the first model (A) was made explicit in B and is shown connected via a switch indicating that current via this conductance was reduced to zero in the presence of apamin. Values used for gKP modulation were as in the first model. Similarly the nitrergic K+ conductance (gKN) proposed in the first model (A) is also made explicit in B and is shown connected by dashed lines indicating that it is a candidate model for the late phase of the IJP. Values used for gKN modulation were as in the first model. The alternative model of the nitrergic component of the IJP was a transient reduction in the rate of discharge unitary potentials.
Figure 2
Figure 2. Effects of apamin, NOLA and PPADs on IJPs recorded from the circular layer of guinea-pig proximal colon
The left-hand column of traces shows a control IJP evoked by supramaximal nerve stimulation (A), the response recorded in apamin (B), and in apamin applied together with NOLA (C). The resting membrane potential was −46 mV throughout. The central column of traces shows a control IJP (D), the response recorded in NOLA (E), and in NOLA applied together with apamin (F). The resting membrane potential was −44 mV throughout. The right-hand column of traces shows a control IJP (G), the response recorded in NOLA (H), and in NOLA applied together with two different concentrations of PPADS (I), with the smaller response being detected in the higher concentration of PPADS. The resting membrane potential was −47 mV throughout. The time and voltage calibration bars apply to all recordings. Atropine (1 μm) and nifedipine (1 μm) were present throughout.
Figure 3
Figure 3. Electrical properties of muscle bundle from the circular layer of guinea-pig distal colon
A, the effects of injecting a series of hyperpolarizing and depolarizing currents on the membrane potential of a short bundle of muscle isolated from the distal colon. Note that the discharge of membrane noise was little affected throughout. The resting potential of this preparation was −44 mV; the time current and voltage calibration bars apply to recordings shown in A. B, spectral density curves illustrating that the discharge of membrane noise (•) was unaffected by adding 9-AC (○) to the physiological saline; the resting potential of the preparation remained unchanged at −40 mV throughout. C, the discharge of membrane noise (•) was reduced by adding MAPTA-AM (20 μm; ○) to the physiological saline for 10 min (Cc). Note that the reduction in membrane noise was associated with an increase in resting potential from −42 mV (Ca) to −51 mV (Cb). Atropine 1 μm and nifedipine (1 μm) were present in each experiment.
Figure 4
Figure 4. Effect of apamin and ODQ on IJPs recorded from the circular layer of guinea-pig proximal colon
The left-hand column of traces shows a control IJP evoked by supramaximal nerve stimulation (A), the response recorded in apamin (B), and in apamin applied together with ODQ (C). The resting membrane potential was −48 mV throughout. The right-hand column of traces shows a control IJP (D), the response recorded in ODQ (E), and in ODQ applied together with apamin (F). The resting membrane potential was −45 mV throughout. The time and voltage calibration bars apply to all recordings; each trace is an average of 20 successive recordings. Atropine (1 μm) and nifedipine (1 μm) were present throughout.
Figure 5
Figure 5. Comparison between experimental determinations of time courses of colonic IJPs with simulations of colonic IJPs
The three overlaid traces presented in A show a control response (dashed line) and responses recorded in either apamin or ODQ; all recordings made from the same cell, resting membrane potential was −48 mV throughout. The three overlaid traces in B show calculated IJPs in which the both the rapid and slow components of the IJP were assumed to be generated by a brief and a slower increase in gK; the response to the sum of these conductance changes is shown as a dashed line. The time course of the initial rapid modulation was defined, using eqn (1) (Methods) as the difference between two exponential functions, raised to a power, N, where g represented the modulation in gK, M scaled the peak modulation to 14 nS, A and B took values of 0.2 s and 0.1 s, respectively, and the exponent N was 1. For the secondary slower modulation the same approach was taken using a value of 100 nS for M, with A and B taking values of 0.9 s and 0.85 s and N taking a value of 1.6. The three traces in C show calculated IJPs in which the rapid component of the IJP was assumed to be generated by a brief increase in gK, using the values of constants given above, followed by the slow component which was assumed to be generated by a decrease in gNa using eqn (1) (Methods): M was chosen to give a 98% peak reduction in gNa, with A and B taking values of 1 s and 0.95 s, respectively, and N taking a value of 2. The response to the sum of these conductance changes is shown as a dashed line. The time and voltage calibration bars apply to all recordings of membrane potential and each set of simulations. Atropine (1 μm) and nifedipine (1 μm) were present in recordings shown in A; each experimental trace is an average of 20 successive recordings.
Figure 6
Figure 6. Effect of changing [K+]o on amplitudes of nitrergic and purinergic compoents of IJP recorded from the circular layer of guinea-pig proximal colon
The three overlaid traces in A show the effect of changing [K+]o from 2.5 to 5 to 10 mm on the amplitudes of the nitrergic component of the IJP, recorded in the presence of apamin. The resting potential in 2.5 and 5 mm [K+]o was −40 mV; it fell to −34 mV in 10 mm [K+]o. B shows the results from this and four other experiments plotted graphically. The three overlaid traces in C show the effect of changing [K+]o from 2.5 to 5 to 10 mm on the amplitudes of the purinergic component of the IJP, recorded from the same cell in the presence of ODQ. D shows the results from this and four other experiments plotted graphically. The time and voltage calibration bars apply to all recordings of membrane potential, each trace is the average of 5 successive recordings. Atropine (1 μm) and a nifedipine (1 μm) were present throughout.
Figure 7
Figure 7. Effect of changing membrane potential on nitrergic IJPs recorded from the circular layer of guinea-pig proximal colon
The upper two sets of traces illustrate calculations which show the effect of changing the membrane potential on the nitrergic component of the IJP if it was assumed to result from an increase in gK (A) or if it was assumed to result from a decrease in gcation (B): each of these traces shows the average of 40 calculations. For details of calculations see Methods. Note that if the IJP resulted from an increase in gK, the amplitude of the IJP decreased as the membrane potential approached the potassium reversal potential (EK). Conversely if the IJP resulted from a decrease in gcation, the amplitude of the IJP increased as the membrane potential approached EK. The upper time and voltage calibration bars apply to both sets of simulations. The overlaid traces in C show the effects of changing membrane potential on the nitrergic component of the IJP; these results are plotted graphically in D and show that the amplitude of the IJP increases with membrane hyperpolarization. The lower time, voltage and current calibration bars apply to experimental observations; each experimental trace is the average of 4 successive responses and the resting potential was −44 mV. Apamin (0.1 μm) atropine (1 μm) and nifedipine (1 μm) were present throughout.
Figure 8
Figure 8. Effect of changing membrane potential on composite IJPs recorded from the circular layer of guinea-pig proximal colon
The upper two sets of traces illustrate calculations which show the effect of changing the membrane potential on the control IJP if it was assumed to result from a brief followed by a slower increase in gK (A) or if it was assumed to result from a brief increase in gK followed by a decrease in gcation (B). For details of calculations see Methods. Note that if the IJP resulted from two separate increases in gK, the time course the IJP did not change as the membrane potential approached EK, with the time to peak hyperpolarization, shown by a dotted line, remaining constant. Conversely if the IJP resulted from an initial increase in gK followed by a decrease in gcation, the time to peak of the IJP, shown by dotted line, increased as the membrane potential approached EK. The upper time and voltage calibration bars apply to both sets of simulations. The overlaid traces in C show the effects of changing membrane potential on the control IJP. Note that the time to peak hyperpolarization, again shown by a dotted line, increased as the membrane potential was made more negative. The lower time, voltage and current calibration bars apply to experimental observations; each experimental trace is the average of 4 successive responses whereas the computations illustrate the average of 40 successive computations. Atropine (1 μm) and nifedipine (1 μm) were present throughout.
Figure 9
Figure 9. Change in standard deviation of membrane noise during a nitrergic IJP recorded from the circular layer of guinea-pig proximal colon
The upper two sets of traces illustrate calculations which show the effect of the nitrergic component of the IJP on the standard deviation if it was assumed to result from an increase in gK (A and B) or if it was assumed to result from a decrease in the discharge of unitary potentials by ICCIM (C and D). For details of calculations see Methods. Note that if the IJP resulted from an increase in gK, the standard deviation was unchanged during the IJP. Conversely if the IJP resulted from a decrease in the discharge of unitary potentials by ICCIM, the standard deviation fell during the IJP. The overlaid experimental traces shown in panel E show 6 successive responses to nerve stimulation; the average of 40 successive sweeps is shown in F. When the mean standard deviation for the successive 40 traces was calculated (G), it was found that the standard deviation fell during the IJP and increased during the rebound potential. The lower time, and current calibration bars apply to experimental observations. Apamin (0.1 μm) atropine (1 μm) and nifedipine (1 μm) were present throughout.

Similar articles

Cited by

References

    1. Baylor DA, Hodgkin AL. Detection and resolution of visual stimuli by turtle photoreceptors. J Physiol. 1973;234:163–198. - PMC - PubMed
    1. Beckett EAH, Bayguinov YR, Sanders KM, Ward SM, Hirst GDS. Properties of unitary potentials generated by intramuscular interstitial cells of Cajal in the murine and guinea-pig gastric fundus. J Physiol. 2004 Accepted for publication subject to suitable change. - PMC - PubMed
    1. Beckett EAH, Horiguchi K, Khoyi M, Sanders KM, Ward SM. Loss of enteric motor neurotransmission in the gastric fundus of Sl/Sld mice. J Physiol. 2002;543:871–887. - PMC - PubMed
    1. Burns AJ, Lomax AE, Torihashi S, Sanders KM, Ward SM. Interstitial cells of Cajal mediate inhibitory neurotransmission in the stomach. Proc Nat Acad Sci. 1996;93:12008–12013. - PMC - PubMed
    1. Bywater RAR, Campbell GD, Edwards FR, Hirst GDS. Effects of vagal stimulation and applied acetylcholine on the arrested sinus venosus of the toad. J Physiol. 1990;425:1–27. - PMC - PubMed

Publication types

LinkOut - more resources