Comparative Study
. 2004 Aug 1;558(Pt 3):793-805.
doi: 10.1113/jphysiol.2003.060186. Epub 2004 Jun 11.

On the fate of skeletal myoblasts in a cardiac environment: down-regulation of voltage-gated ion channels

Affiliations
Comparative Study

On the fate of skeletal myoblasts in a cardiac environment: down-regulation of voltage-gated ion channels

H C Ott et al. J Physiol. .

Abstract

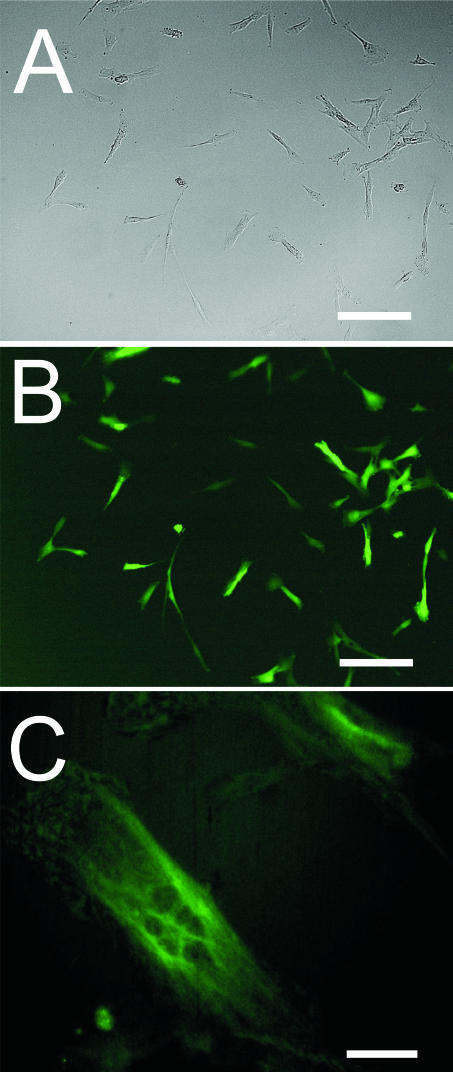
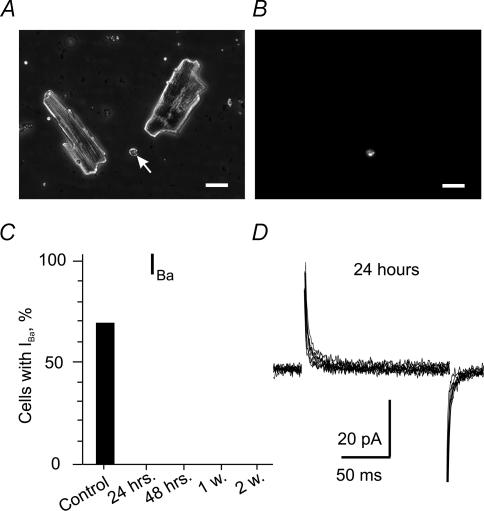
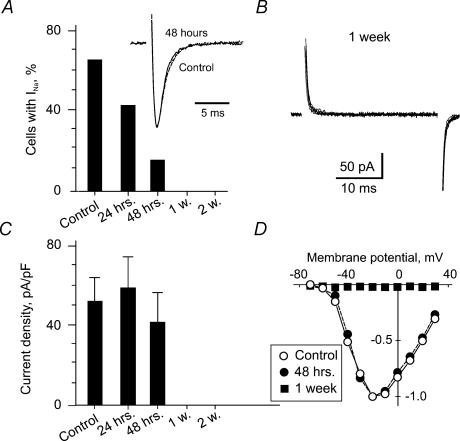
We have analysed the voltage-gated ion channels and fusion competence of skeletal muscle myoblasts labelled with green fluorescent protein (GFP) and the membrane dye PKH transplanted into the infarcted myocardium of syngenic rats. After cell transplantation the animals were killed and GFP(+)-PKH(+) myoblasts enzymatically isolated for subsequent studies of ionic currents through voltage-gated sodium, calcium and potassium channels. A down-regulation of all three types of ion channels after engraftment was observed. The fraction of cells with calcium (68%) and sodium channels (65%) declined to zero within 24 h and 1 week, respectively. Down-regulation of potassium currents (90% in control) occurred within 2 weeks to about 30%. Before injection myoblasts expressed predominantly transient outward potassium channels whereas after isolation from the myocardium exclusively rapid delayed rectifier channels. The currents recovered completely between 1 and 6 weeks under cell culture conditions. The down-regulation of ion channels and changes in potassium current kinetics suggest that the environment provided by infarcted myocardium affects expression of voltage-gated ion channels of skeletal myoblasts.


Figures

Figure 1
Figure 1. Clonal cultures of GFP+ myoblasts
A, phase-contrast image of clonal GFP-transfected rat myoblast culture. B, fluorescence image of the culture shown in A. C, myotube formation in GFP+ myoblasts after 5 days in differentiating medium (see Methods). The scale bars correspond to 100 μm.
Figure 2
Figure 2. Voltage-dependent barium, sodium and potassium currents in cultured myoblasts
A, IBa through T-type Ca2+ channels in GFP+ myoblasts (left panel). Currents were evoked by 150 ms depolarizing pulses from a holding potential of −100 mV. Corresponding current–voltage relationship of the IBa peak is shown in the right panel. B, representative family of INa (left panel). Currents were evoked by 10 ms depolarizations from a holding potential of −120 mV. Right panel shows corresponding current–voltage relationship of peak INa. C, representative traces of IKto (left panel). Currents were evoked by 300 ms depolarizations from a holding potential of −60 mV to indicated test potentials. Right panel: corresponding current–voltage relationship of the peak current. D, representative traces of IKur (left panel, same pulse protocol as in C) and corresponding current–voltage relationship of the peak current (right panel).
Figure 3
Figure 3. Down-regulation of barium currents in transplanted myoblasts
A, cell suspension after enzymatic isolation (see Methods). The phase-contrast image shows two cardiomyocytes and one myoblast (indicated with arrow) isolated 24 h after implantation. The scale bar corresponds to 50 μm. B, the corresponding fluorescence image highlights the PKH+ myoblast. C, percentage of cells positive for Ca2+ channel currents in control and complete absence of currents at ≥ 24 h after myoblast injection. D, typical traces during stepwise depolarization of the membrane (same voltage protocol as in Fig. 2B) of a GFP+ cell isolated 24 h after implantation.
Figure 4
Figure 4. Down-regulation of sodium currents in transplanted myoblasts
A, bar graph illustrating the progressing reduction of the cell fraction with detectable INa. Inset: superimposed INa (pulse from −120 to −20 mV) of a control myoblast and a myoblast isolated 48 h after implantation. B, representative whole cell recordings from a myoblast isolated 1 week after transplantation (same protocol as in Fig. 2B). C, mean INa densities (pA pF−1) at different times after implantation. Current densities estimated 24 and 48 h after injection did not significantly differ from control (P > 0.05, n = 8 and n = 4 for 24 and 48 h, respectively). D, superimposed current–voltage relationships of peak INa in control (○), and GFP+ myoblasts isolated after 48 h (•) and 1 week (▪) after cell implantation.
Figure 5
Figure 5. Down-regulation of potassium currents
A, IKto was detected in a majority of control cells, while only a few cells showed IKur. In cells isolated from the myocardium we observed exclusively IKur currents and not the fast inactivating currents found in control (Fig. 2C). The percentage of cells with IKur gradually declined within 2 weeks. B, typical whole cell recordings from a cell isolated 2 weeks after implantation. IKur were evoked by 300 ms test pulses from −60 mV. Traces corresponding to the test potentials of −20, 0, 20 … 80 mV are shown. C, IKur densities in cells isolated at different time intervals after cell transplantation compared to control. Current amplitudes were measured during membrane depolarizations from a holding potential of −60 mV to +50 mV. The current densities were not significantly different (P > 0.05) from control (n = 21), 24 h (n = 15), 48 h (n = 12), 1 and 2 weeks (n = 6). D, current–voltage relationship of peak IKur of the experiment shown in B.
Figure 6
Figure 6. Recovery of sodium and barium currents in cell culture
A, photomicrograph of a 48 h primary culture of cells isolated from the myocardium 2 weeks after implantation. GFP+ myoblasts (arrows) are surrounded by non-fluorescent cells. B, fluorescent image of A. Scale bars in A and B correspond to 25 μm. C, fluorescent image of clonal GFP+ rat myoblast culture deduced from a single GFP+ cell isolated from the myocardium 2 weeks after implantation. All cells expressed the marker gene. D, the GFP+ cultures were stained with antibodies against desmin as described in Methods. All cells were found to be desmin positive. The scale bars in C and D correspond to 30 μm. E and F, the fraction of myoblasts with INa and IBa steadily increased with time. Insets: representative families of INa and IBa in GFP+ myoblast after 6 weeks in culture. Currents were evoked by the protocols described in Fig. 2. Voltage dependence and current kinetics were indistinguishable from control. The IBa inactivation time constant at −20 mV was 12.7 ± 0.5 ms (n = 9) versus 13.4 ± 0.4 ms in control (n = 7, P > 0.05). INa inactivated at −20 mV with a time constant of 1.72 ± 0.07 ms (n = 9) versus 1.55 ± 0.07 ms in control (n = 15, P > 0.05).
Figure 7
Figure 7. Recovery of potassium currents in cell culture
A, time-dependent increase in the number of myoblasts displaying IK. Only slow inactivating IKur currents were detected in cells isolated from the myocardium. Notably, after 6 weeks in culture the fraction of cells with detectable IK (i.e. IKur) was not statistically different from control cells expressing either type of IK (P > 0.05). B, representative family of IKur in a myoblast culture 6 weeks after cell isolation. Currents were evoked by 300 ms depolarizations from −60 mV to 90 mV with 10 mV increments. C, peak current–voltage relationship of the experiment shown in B. D, myotube formation in GFP+ myoblasts in a clonal culture isolated from myocardium (see Methods). The picture represents superposition of phase-contrast and fluorescence images. Blue colour highlights Dapi stained nuclei. The scale bar corresponds to 50 μm.
Figure 8
Figure 8. Skeletal muscle phenotype of myoblasts isolated from the myocardium
In differentiation medium the GFP-positive cells fused into multinucleated myotubes. The figure illustrates the initial stage of myotube formation (day 1 in differentiation medium). The multinucleated myotube stained positive for MHC (A) and GFP (B). Scale bars correspond to 30 μm.

Similar articles

Cited by

References

    1. Baroffio A, Hamann M, Bernheim L, Bochaton-Piallat ML, Gabbiani G, Bader CR. Identification of self-renewing myoblasts in the progeny of single human muscle satellite cells. Differentiation. 1996;60:47–57. - PubMed
    1. Beam KG, Knudson CM. Calcium currents in embryonic and neonatal mammalian skeletal muscle. J General Physiol. 1988;91:781–798. - PMC - PubMed
    1. Beltrami AP, Urbanek K, Kajstura J, Yan SM, Finato N, Bussani R, et al. Evidence that human cardiac myocytes divide after myocardial infarction. N Engl J Med. 2001;344:1750–1757. - PubMed
    1. Berridge MJ, Bootman MD, Lipp P. Calcium: a life and death signal. Nature. 1998;395:645–648. - PubMed
    1. Bijlenga P, Liu JH, Espinos E, Haenggeli CA, Fischer-Lougheed J, Bader CR, et al. T-type alpha 1H Ca2+ channels are involved in Ca2+ signaling during terminal differentiation (fusion) of human myoblasts. Proc Natl Acad Sci U S A. 2000;97:7627–7632. - PMC - PubMed

Publication types

LinkOut - more resources