. 2004 Jul;78(13):7138-47.
doi: 10.1128/JVI.78.13.7138-7147.2004.

Actin cytoskeletal reorganizations and coreceptor-mediated activation of rac during human immunodeficiency virus-induced cell fusion

Affiliations

Actin cytoskeletal reorganizations and coreceptor-mediated activation of rac during human immunodeficiency virus-induced cell fusion

S E Pontow et al. J Virol. 2004 Jul.

Abstract

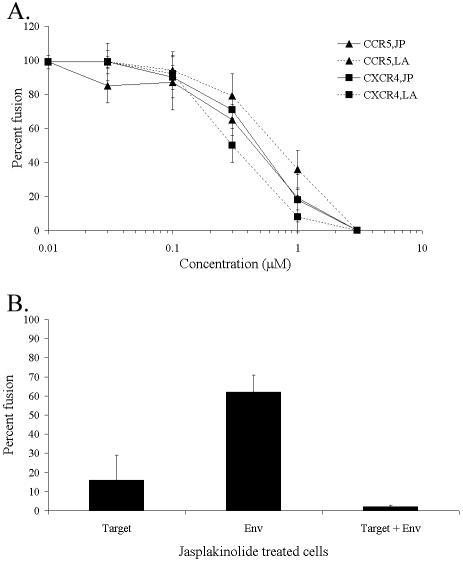
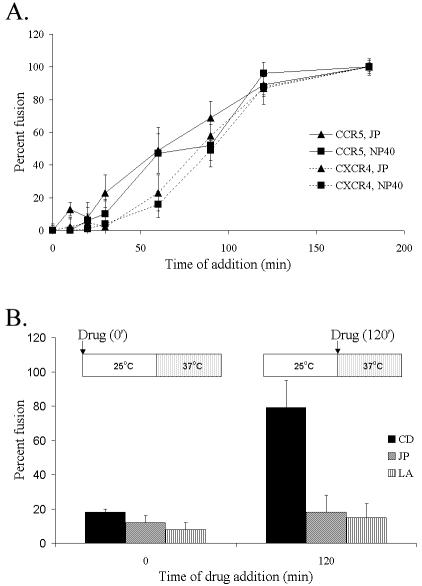
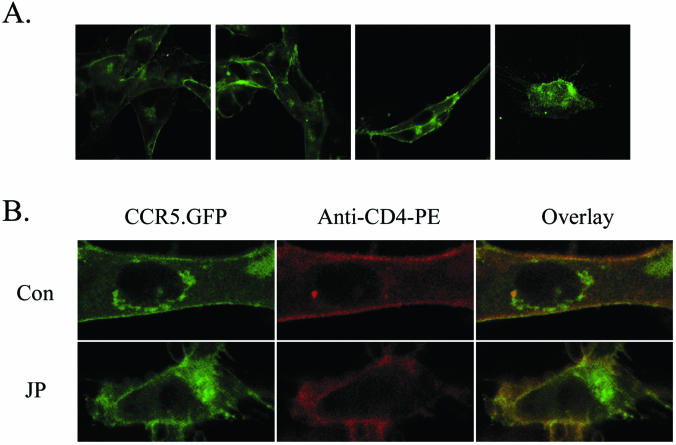
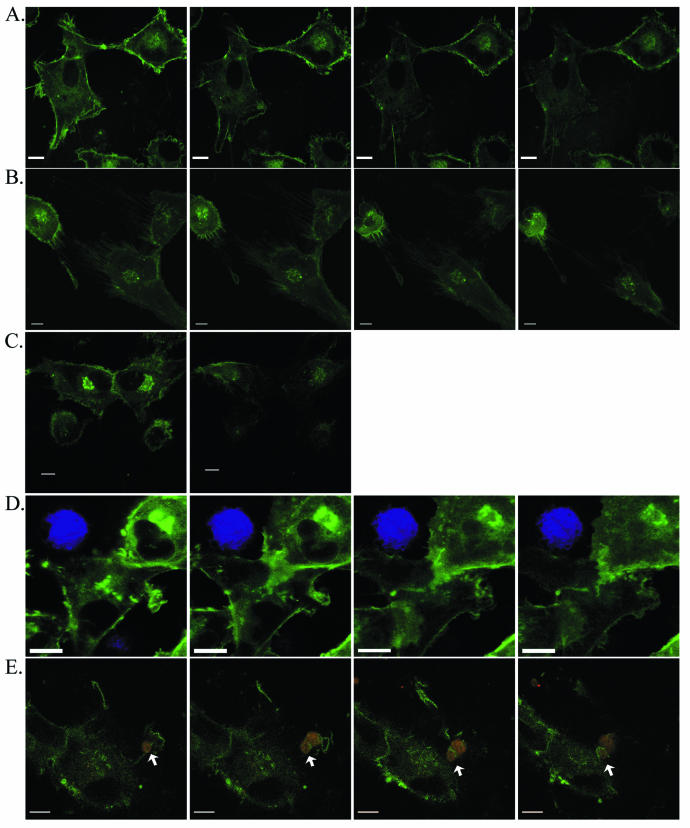
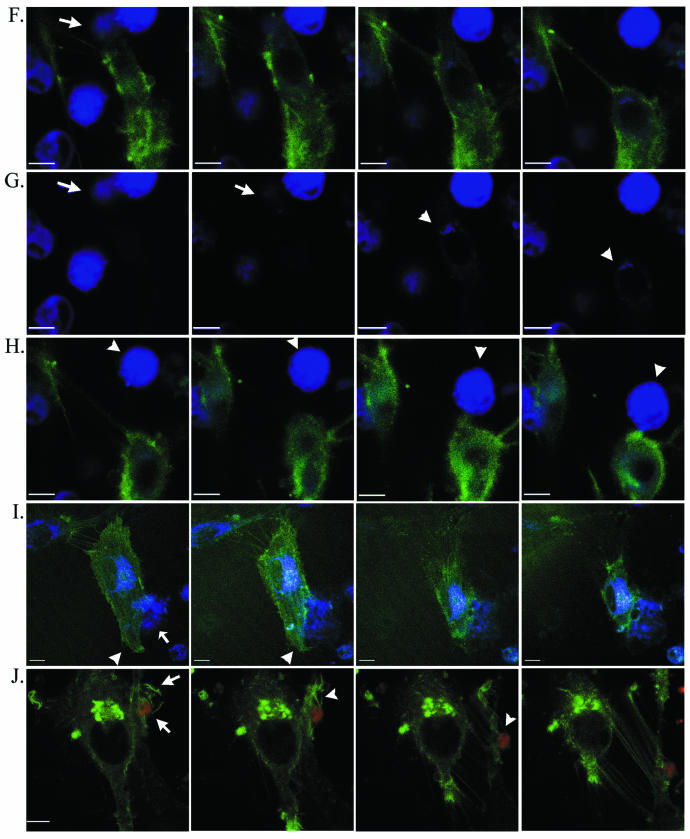
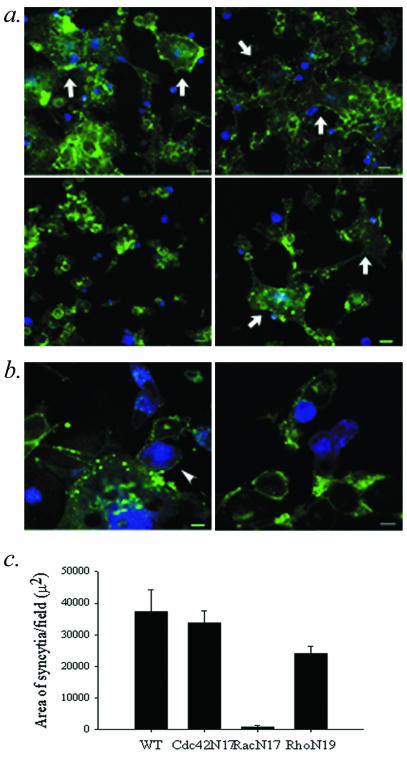
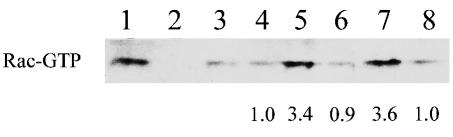
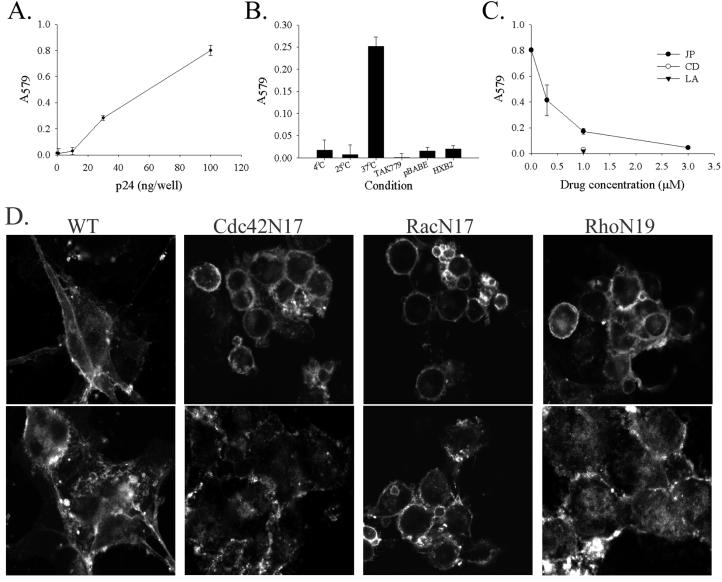
The membrane fusion events which initiate human immunodeficiency virus type 1 (HIV-1) infection and promote cytopathic syncytium formation in infected cells commence with the binding of the HIV envelope glycoprotein (Env) to CD4 and an appropriate coreceptor. Here, we show that HIV Env-coreceptor interactions activate Rac-1 GTPase and stimulate the actin filament network reorganizations that are requisite components of the cell fusion process. Disrupting actin filament dynamics with jasplakinolide or latrunculin A arrested fusion at a late step in the formation of Env-CD4-coreceptor complexes. Time-lapse confocal microscopy of living cells revealed vigorous activity of actin-based, target cell membrane extensions at the target cell-Env-expressing cell interface. The expression of dominant-negative forms of actin-regulating Rho-family GTPases established that HIV Env-mediated syncytium formation relies on Rac-1 but not on Cdc42 or Rho activation in target cells. Similar dependencies were found when cell fusion was induced by Env expressed on viral or cellular membranes. Additionally, Rac activity was specifically upregulated in a coreceptor-dependent manner in fusion reaction cell lysates. These results define a role for HIV Env-coreceptor interactions in activating the cellular factors essential for virus-cell and cell-cell fusion and provide evidence for the participation of pertussis toxin-insensitive signaling pathways in HIV-induced membrane fusion.


Figures

FIG. 1.
FIG. 1.
Actin-dependent cell fusion. Average fusion compared to untreated control reactions and detected by β-galactosidase activity ± standard deviation are shown. (A) CCR5- or CXCR4-expressing U87.CD4 cells were incubated with HIVADA or HIVHXB2 Env-expressing cells, respectively, in the presence of JP or LA at the indicated concentrations. (B) U87.CD4.CCR5 cells and/or HIVADA Env-expressing cells were treated with JP for 10 min and washed extensively prior to mixing. In each case, representative data from 1 of 4 experiments are shown.
FIG. 2.
FIG. 2.
Actin filament network involvement late in the HIV Env-induced cell fusion pathway. Average fusion compared to untreated control reactions and detected by β-galactosidase activity ± standard deviation are shown. (A) CCR5- or CXCR4-expressing U87.CD4 cells were incubated with HIVADA or HIVHXB2 Env-expressing cells, respectively, with JP or NP-40 added at the indicated times. (B) U87.CD4.CCR5 cells were incubated with HIVADA Env-expressing cells at 25°C for 2 h and then were warmed to 37°C for 1 h. As indicated, drugs were added before or after the 25°C incubation. Each graph is representative of data from 1 of 4 experiments.
FIG. 3.
FIG. 3.
Effect of JP treatment on cell morphology and surface localization of CD4 and CCR5.GFP cells. (A) Confocal micrographs of U87.CD4.CCR5 cells fixed after 30 min of incubation with JP at final concentrations of (from left to right) 0, 0.1, 1.0, and 3.0 μM. (B) Confocal micrographs of U87.CD4.CCR5 cells fixed before (upper panels) or after (lower panels) JP treatment (3 μM; 10 min) and stained with anti-CD4-phycoerythrin antibodies. The green GFP signal and red phycoerythrin signal have been merged to show areas of colocalization (yellow). Note the collapsed appearance of the JP-treated cell. Data are representative of results from 3 experiments. Images were collected by using an oil objective (magnification, ×63). Con, control.
FIG. 4.
FIG. 4.
Time-lapse confocal microscopy. Selected images from sequential scans (see Videos S1 and S2 in supplemental material) of living U87.CD4.CCR5.GFP target cells (green) with and without Env-expressing cells (panel D, HIVHXB2 Env; panels E to J, HIVYU2 Env) combined for HIV-induced fusion. Env-expressing cells are blue in panel D and panels F to I and red in panels E and J. Cells with which targets fuse are indicated with an arrow in panels F, G, and I. An Env-expressing cell is indicated with an arrow in E and an arrowhead in H. Arrowheads in I highlight the dynamic membrane structures formed at the leading edge of the target cell. Panels in G are single-channel (blue) renditions of panels in F to facilitate visualization of dye transfer (arrowheads). Scans were captured at (from left to right) 0, 6.2,13.8, and 23.5 min (A); at 0.8, 2.1, 3.0, and 6.2 min, with JP added at 1 min (B); at 0 and 20 min, with JP added at 0.2 min and no intervening scans acquired (C); at 0.5, 2.3, 8.7, and 13.8 min (D); at 0, 0.8, 7.0, and 15.6 min (E); at 7.6, 9.6, 9.8, and 9.9 min (F and G); at 10.2, 10.6, 12.0, and 17.3 min (H); at 0, 6.7, 16.9, and 19.5 min (I); or at 9, 12.3, 14.3, and 17.8 min, with JP added at 10 min (J). For panels A to H and J, time zero indicates the time when cells were warmed to 37°C. For panel I, time zero is 60 min after the cells were warmed to 37°C. Bar = 10 μm.
FIG. 4.
FIG. 4.
Time-lapse confocal microscopy. Selected images from sequential scans (see Videos S1 and S2 in supplemental material) of living U87.CD4.CCR5.GFP target cells (green) with and without Env-expressing cells (panel D, HIVHXB2 Env; panels E to J, HIVYU2 Env) combined for HIV-induced fusion. Env-expressing cells are blue in panel D and panels F to I and red in panels E and J. Cells with which targets fuse are indicated with an arrow in panels F, G, and I. An Env-expressing cell is indicated with an arrow in E and an arrowhead in H. Arrowheads in I highlight the dynamic membrane structures formed at the leading edge of the target cell. Panels in G are single-channel (blue) renditions of panels in F to facilitate visualization of dye transfer (arrowheads). Scans were captured at (from left to right) 0, 6.2,13.8, and 23.5 min (A); at 0.8, 2.1, 3.0, and 6.2 min, with JP added at 1 min (B); at 0 and 20 min, with JP added at 0.2 min and no intervening scans acquired (C); at 0.5, 2.3, 8.7, and 13.8 min (D); at 0, 0.8, 7.0, and 15.6 min (E); at 7.6, 9.6, 9.8, and 9.9 min (F and G); at 10.2, 10.6, 12.0, and 17.3 min (H); at 0, 6.7, 16.9, and 19.5 min (I); or at 9, 12.3, 14.3, and 17.8 min, with JP added at 10 min (J). For panels A to H and J, time zero indicates the time when cells were warmed to 37°C. For panel I, time zero is 60 min after the cells were warmed to 37°C. Bar = 10 μm.
FIG. 5.
FIG. 5.
Rho-GTPases and cell-cell fusion. (a and b) Confocal micrographs of target cells (green) incubated for 2.5 h with Env-expressing cells (blue) to induce fusion. (c) The average area per field occupied by syncytia. Shown is the average of 10 fields ± standard error of the means. Target cells were infected with WT vaccinia (a, upper left frame; b, left frame) or with recombinant vaccinia viruses expressing Cdc42N17 (a, upper right frame), RacN17 (a, lower left frame; b, right frame) or RhoN19 (a, lower right frame). Syncytia are indicated with arrows. Target cell membrane extension is indicated with an arrowhead (b, left frame). Bars, 30 μm (a) and 10 μm (b). Representative data from 1 of 3 experiments are shown.
FIG. 6.
FIG. 6.
Rac activation and cell-cell fusion. Western blot analysis of PAK-1 binding fractions from lysates of U87.CD4.CCR5 cells mixed with BSC40 cells expressing no Env (lane 3) or Env from HIV-1 strains ADA (lanes 1, 2 and 4 to 6), YU2 (lane 7), or HXB2 (lane 8) at 37°C for 10 min (lane 4) or 30 min (lanes 1 to 3 and 5 to 8). TAK-779 was included to inhibit CCR5-Env binding (lane 6). Positive (lane 1) and negative (lane 2) controls were generated by GTPγS- and GDP-loading of reaction lysates, respectively. Increases (n-fold) in the amount of Rac-GTP compared to lane 3 were determined by densitometry and are indicated below the blots. Data represent results from 1 of 2 experiments with similar results.
FIG. 7.
FIG. 7.
The actin cytoskeleton and Rac activation in virus-dependent cell fusion. Fusion of U87.CD4.CCR5.GFP cells incubated with increasing amounts (A) or 100 ng of HIVYU2 per well (B to D) at 37°C (except where noted in B). In panels A to C, relative fusion is indicated by β-galactosidase activity (average A579 of triplicate wells ± standard deviation; data are representative of results from three similar experiments). (D) U87.CD4.CCR5.GFP cells were infected with WT vaccinia or vaccinia viruses encoding the dominant-negative point mutants Cdc42N17, RacN17, or RhoN19 as indicated, prior to incubation with HIVHXB2 (upper panels) or HIVYU2 (lower panels), fixation, and confocal microscopy. Images were collected by using an oil objective (magnification, ×63). The experiment was performed twice with similar results.

Similar articles

Cited by

References

    1. Alkhatib, G., M. Locati, P. E. Kennedy, P. M. Murphy, and E. A. Berger. 1997. HIV-1 coreceptor activity of CCR5 and its inhibition by chemokines: independence from G protein signaling and importance of coreceptor downmodulation. Virology 234:340-348. - PubMed
    1. Amara, A., A. Vidy, G. Boulla, K. Mollier, J. Garcia-Perez, J. Alcami, C. Blanpain, M. Parmentier, J.-L. Virelizier, P. Charneau, and F. Arenzana-Seisdedos. 2003. G protein-dependent CCR5 signaling is not required for efficient infection of primary T lymphocytes and macrophages by R5 human immunodeficiency virus type 1 isolates. J. Virol. 77:2550-2558. - PMC - PubMed
    1. Biscone, M. J., T. C. Pierson, and R. W. Doms. 2002. Opportunities and challenges in targeting HIV entry. Curr. Opin. Pharmacol. 2:529-533. - PubMed
    1. Bubb, M. R., I. Spector, B. B. Beyer, and K. M. Fosen. 2000. Effects of jasplakinolide on the kinetics of actin polymerization. An explanation for certain in vivo observations. J. Biol. Chem. 275:5163-5170. - PubMed
    1. Cicala, C., J. Arthos, M. Ruiz, M. Vaccarezza, A. Rubbert, A. Riva, K. Wildt, O. Cohen, and A. S. Fauci. 1999. Induction of phosphorylation and intracellular association of CC chemokine receptor 5 and focal adhesion kinase in primary human CD4+ T cells by macrophage-tropic HIV envelope. J. Immunol. 163:420-426. - PubMed

Publication types