

doi: 10.1128/JVI.78.13.7284-7287.2004.
Ex vivo phenotype and frequency of influenza virus-specific CD4 memory T cells
Affiliations
- PMID: 15194806
- PMCID: PMC421690
- DOI: 10.1128/JVI.78.13.7284-7287.2004
Item in Clipboard
Ex vivo phenotype and frequency of influenza virus-specific CD4 memory T cells
J Virol.
2004 Jul.
Abstract
Recent advances in class II tetramer staining technology have allowed reliable direct ex vivo visualization of antigen-specific CD4 T cells. In order to define the frequency and phenotype of a prototype response to a nonpersistent pathogen, we have used such techniques to analyze influenza virus-specific memory CD4 T cells directly from blood. These responses are stably detectable ex vivo at low frequencies (range, 0.00012 to 0.0061% of CD4 T cells) and display a distinct "central memory" CD62L(+) phenotype.
Figures
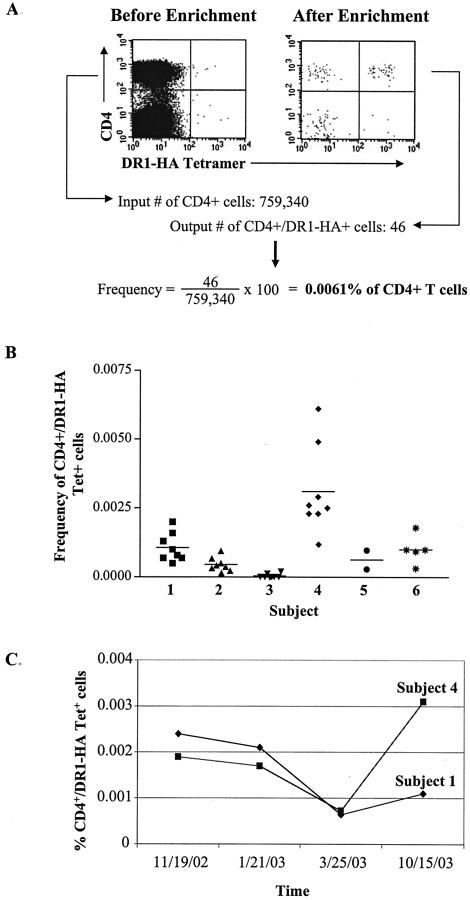
Frequencies of circulating DR1-HA tetramer-positive cells ex vivo. (A) Example of ex vivo DR1-HA tetramer staining of CD4 T cells before and after magnetic bead enrichment for PE-positive cells. PBMCs were stained with PE-conjugated DR1-HA tetramer, APC-conjugated anti-CD4 antibody, PerCP-conjugated anti-CD14 and -CD19 antibodies to exclude monocytes and B cells, respectively, and Via-Probe to exclude dead cells. Cells were incubated with anti-PE microbeads, and PE-positive cells were selected (enriched) on a magnetic column. Plots are gated on CD4+ CD14− CD19− Via-Probe− cells. The plot on the left shows DR1-HA tetramer staining of CD4+ cells before enrichment, and the plot on the right shows the same cell population after enrichment. The frequency of DR1-HA tetramer-positive cells after enrichment was calculated by dividing the number of CD4+ tetramer+ cells after enrichment by the input number of CD4 cells. In this example, the input number of CD4 cells was 759,340 and the output number of CD4+ DR1-HA+ cells was 46. (B) Reproducibility of the frequency estimations of DR1-HA tetramer-positive cells in six healthy DR1-positive individuals from a single time point. Between two and eight replicate tetramer staining assays were performed on a single PBMC collection from each subject. The frequency of tetramer-positive cells was analyzed as described above. The horizontal bar represents the mean tetramer-positive frequency for each individual. (C) Longitudinal analysis of DR1-HA tetramer-positive cells in two DR1-positive individuals. Four PBMC samples were obtained over a 12-month period and analyzed as described above. The mean frequency of DR1-HA tetramer-positive cells at each time point is plotted for subjects 1 and 4.
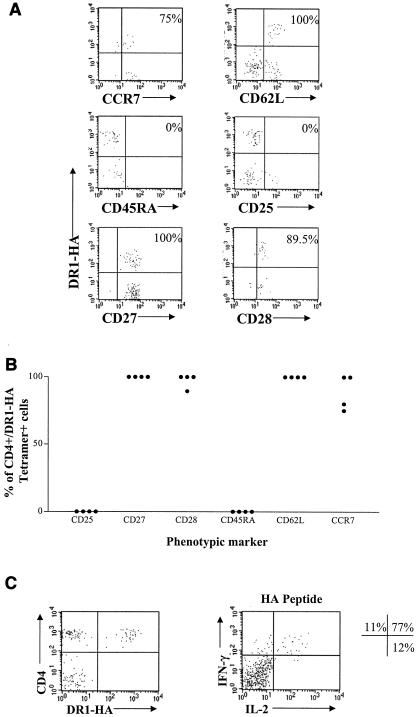
Ex vivo phenotypic and functional analysis of DR1-HA tetramer-positive cells. (A) Example of phenotypic analysis on DR1-HA tetramer-positive cells for six markers pertaining to memory status of CD4+ T cells. Fresh PBMCs were stained as described for Fig. 1A with the addition of an FITC-conjugated antibody for either CD25, CD27, CD28, CD45RA, CD62L, or CCR7. Plots are shown after enrichment for PE-positive cells and are gated on CD4+ CD14− CD19− Via-Probe− events as described for Fig. 1. The frequency shown indicates the percentage of CD4+ DR1-HA tetramer+ cells positive for each marker. These results were obtained from subjects 1 and 4. (B) Summary of phenotypic data for four DR1-positive individuals. Individual data points were obtained as described above. (C) Ex vivo functional analysis of HA-specific CD4 cells. The plot on the left indicates enrichment for DR1-HA tetramer-positive cells from subject 6; the frequency of tetramer-positive cells in this subject was 0.0018% of CD4 T cells. PBMCs from the same time point were stimulated with the DR1-HA peptide (aa 306 to 318) for 6 h at 37°C, followed by enrichment for IFN-γ- and IL-2-positive cells with the IL-2 (PE) and IFN-γ (APC) secretion assay cell enrichment and detection kits according to the instructions of the manufacturer (Miltenyi Biotec). The percentages shown indicate the relative proportions of CD4 cells producing IFN-γ and/or IL-2 following stimulation with the HA peptide; background levels of nonspecific cytokine production have been subtracted. The total frequency of cytokine-positive cells after subtraction of background in this subject was 0.0017%. The frequencies of IFN-γ single-positive, IFN-γ IL-2 double-positive, and IL-2 single-positive cells were 0.00018, 0.0013, and 0.00021%, respectively, of CD4 cells.
Similar articles
-
Characterization of CD4+ memory T cell responses directed against common respiratory pathogens in peripheral blood and lung.J Infect Dis. 2007 Jun 1;195(11):1718-25. doi: 10.1086/517612. Epub 2007 Apr 16. J Infect Dis. 2007. PMID: 17471443
-
Use of MHC class II tetramers to investigate CD4+ T cell responses: problems and solutions.Cytometry A. 2008 Nov;73(11):1010-8. doi: 10.1002/cyto.a.20603. Cytometry A. 2008. PMID: 18612991
-
CC chemokine receptor 7 expression by effector/memory CD4+ T cells depends on antigen specificity and tissue localization during influenza A virus infection.J Virol. 2004 Jul;78(14):7528-35. doi: 10.1128/JVI.78.14.7528-7535.2004. J Virol. 2004. PMID: 15220427 Free PMC article.
-
Immunodominance in CD4 T-cell responses: implications for immune responses to influenza virus and for vaccine design.Expert Rev Vaccines. 2007 Jun;6(3):357-68. doi: 10.1586/14760584.6.3.357. Expert Rev Vaccines. 2007. PMID: 17542751 Review.
-
CD4+ T-cell memory: generation and multi-faceted roles for CD4+ T cells in protective immunity to influenza.Immunol Rev. 2006 Jun;211:8-22. doi: 10.1111/j.0105-2896.2006.00388.x. Immunol Rev. 2006. PMID: 16824113 Free PMC article. Review.
Cited by
-
Major Histocompatibility Complex Class II Dextramers: New Tools for the Detection of antigen-Specific, CD4 T Cells in Basic and Clinical Research.Scand J Immunol. 2015 Nov;82(5):399-408. doi: 10.1111/sji.12344. Scand J Immunol. 2015. PMID: 26207337 Free PMC article. Review.
-
Dynamic relationship between IFN-gamma and IL-2 profile of Mycobacterium tuberculosis-specific T cells and antigen load.J Immunol. 2007 Apr 15;178(8):5217-26. doi: 10.4049/jimmunol.178.8.5217. J Immunol. 2007. PMID: 17404305 Free PMC article.
-
The physiological role of cytotoxic CD4(+) T-cells: the holy grail?Clin Exp Immunol. 2004 Oct;138(1):10-3. doi: 10.1111/j.1365-2249.2004.02605.x. Clin Exp Immunol. 2004. PMID: 15373899 Free PMC article. Review. No abstract available.
-
Class II major histocompatibility complex tetramer staining: progress, problems, and prospects.Immunology. 2008 Mar;123(3):305-13. doi: 10.1111/j.1365-2567.2007.02801.x. Immunology. 2008. PMID: 18251991 Free PMC article. Review.
-
Humoral and cell-mediated immune responses to H5N1 plant-made virus-like particle vaccine are differentially impacted by alum and GLA-SE adjuvants in a Phase 2 clinical trial.NPJ Vaccines. 2018 Jan 23;3:3. doi: 10.1038/s41541-017-0043-3. eCollection 2018. NPJ Vaccines. 2018. PMID: 29387473 Free PMC article.
References
-
- Altman, J. D., P. A. Moss, P. J. Goulder, D. H. Barouch, M. G. McHeyzer-Williams, J. I. Bell, A. J. McMichael, and M. M. Davis. 1996. Phenotypic analysis of antigen-specific T lymphocytes. Science 274:94-96. - PubMed
-
- Appay, V., P. R. Dunbar, M. Callan, P. Klenerman, G. M. Gillespie, L. Papagno, G. S. Ogg, A. King, F. Lechner, C. A. Spina, S. Little, D. V. Havlir, D. D. Richman, N. Gruener, G. Pape, A. Waters, P. Easterbrook, M. Salio, V. Cerundolo, A. J. McMichael, and S. L. Rowland-Jones. 2002. Memory CD8+ T cells vary in differentiation phenotype in different persistent virus infections. Nat. Med. 8:379-385. - PubMed
-
- Brosterhus, H., S. Brings, H. Leyendeckers, R. A. Manz, S. Miltenyi, A. Radbruch, M. Assenmacher, and J. Schmitz. 1999. Enrichment and detection of live antigen-specific CD4+ and CD8+ T cells based on cytokine secretion. Eur. J. Immunol. 29:4053-4059. - PubMed
-
- Cunliffe, S. L., J. R. Wyer, J. K. Sutton, M. Lucas, G. Harcourt, P. Klenerman, A. J. McMichael, and A. D. Kelleher. 2002. Optimization of peptide linker length in production of MHC class II/peptide tetrameric complexes increases yield and stability, and allows identification of antigen-specific CD4+ T cells in peripheral blood mononuclear cells. Eur. J. Immunol. 32:3366-3375. - PubMed
Publication types
MeSH terms
Substances
LinkOut - more resources
Full Text Sources
Other Literature Sources
Research Materials
