EEG-fMRI of focal epileptic spikes: analysis with multiple haemodynamic functions and comparison with gadolinium-enhanced MR angiograms
- PMID: 15195285
- PMCID: PMC6871989
- DOI: 10.1002/hbm.20024
EEG-fMRI of focal epileptic spikes: analysis with multiple haemodynamic functions and comparison with gadolinium-enhanced MR angiograms
Abstract
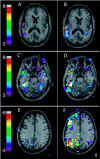
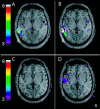
Combined EEG-fMRI has recently been used to explore the BOLD responses to interictal epileptiform discharges. This study examines whether misspecification of the form of the haemodynamic response function (HRF) results in significant fMRI responses being missed in the statistical analysis. EEG-fMRI data from 31 patients with focal epilepsy were analysed with four HRFs peaking from 3 to 9 sec after each interictal event, in addition to a standard HRF that peaked after 5.4 sec. In four patients, fMRI responses were correlated with gadolinium-enhanced MR angiograms and with EEG data from intracranial electrodes. In an attempt to understand the absence of BOLD responses in a significant group of patients, the degree of signal loss occurring as a result of magnetic field inhomogeneities was compared with the detected fMRI responses in ten patients with temporal lobe spikes. Using multiple HRFs resulted in an increased percentage of data sets with significant fMRI activations, from 45% when using the standard HRF alone, to 62.5%. The standard HRF was good at detecting positive BOLD responses, but less appropriate for negative BOLD responses, the majority of which were more accurately modelled by an HRF that peaked later than the standard. Co-registration of statistical maps with gadolinium-enhanced MRIs suggested that the detected fMRI responses were not in general related to large veins. Signal loss in the temporal lobes seemed to be an important factor in 7 of 12 patients who did not show fMRI activations with any of the HRFs.
Copyright 2004 Wiley-Liss, Inc.
Figures


References
-
- Al Asmi A, Bénar C‐G, Gross DW, Agha Khani Y, Andermann F, Pike B, Dubeau F, Gotman J (2003): fMRI activation in continuous and spike‐triggered EEG‐fMRI studies of epileptic spikes. Epilepsia 44: 1328–1339. - PubMed
-
- Aguirre GK, Zarahn E, D'Esposito (1998): The variability of human BOLD hemodynamic responses. Neuroimage 8: 360–369. - PubMed
-
- Bénar C‐G, Gross DW, Wang Y, Petre V, Pike B, Dubeau F, Gotman J (2002): The BOLD response to interictal epileptiform discharges. Neuroimage 17: 1182–1192. - PubMed
-
- Binnie CD, Rowan AJ, Gutter T (1982): A manual of electroencephalographic technology. Cambridge, UK: Cambridge University Press.
-
- Born AP, Law I, Lund TE, Rostrup E, Hanson LG, Wildschiødtz G, Lou HC, Paulson OB (2002): Cortical deactivation induced by visual stimulation in human slow wave sleep. Neuroimage 17: 325–1335. - PubMed
Publication types
MeSH terms
Substances
LinkOut - more resources
Full Text Sources
Medical

