. 2004 Jul;22(3):236-45.
doi: 10.1002/hbm.20033.

Executive processes in Parkinson's disease: FDG-PET and network analysis

Affiliations

Executive processes in Parkinson's disease: FDG-PET and network analysis

Catherine Lozza et al. Hum Brain Mapp. 2004 Jul.

Abstract

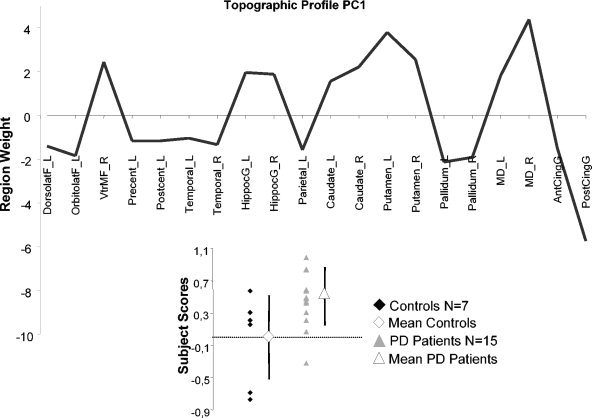
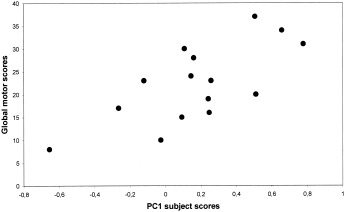
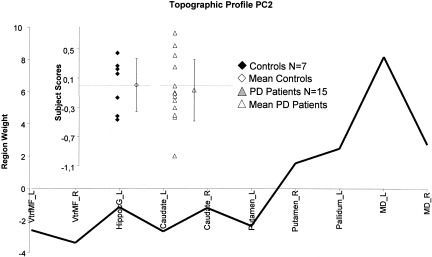
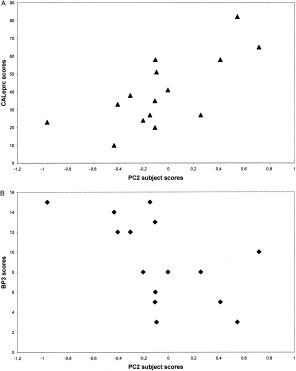
It is assumed widely that the clinical expression of Parkinson's Disease (PD), both motor and cognitive, is subtended by topographically distributed brain networks. However, little is known about the functional neuroanatomy of executive dysfunction in PD. Our objective was to validate further in a PD group the use of network analysis to assess the relationship between executive processes and pathological disorganization of frontostriatal networks. We studied 15 patients with idiopathic PD, and 7 age-matched normal controls, using resting [(18)F]fluorodeoxyglucose (FDG) and high-resolution positron emission tomography (PET). We carried out network analysis on regional metabolic data to identify specific covariation patterns associated with motor and executive dysfunction. We detected two independent patterns relating respectively to the two clinical abnormalities. The first pattern (principal component 1) was topographically similar to that described previously in other PD populations. Subject scores for this pattern discriminated patients from controls and correlated significantly with bradykinesia ratings (P = 0.013, r = 0.655) in PD patients. The second pattern (principal component 2) was characterized by relative ventromedial frontal, hippocampal, and striatal hypometabolism, associated with mediodorsal thalamic hypermetabolism. In the PD group, scores from this pattern correlated with scores on the conditional associative learning (CAL; P = 0.01, r = 0.690) and the Brown Peterson paradigm (BPP; P = 0.017, r = -0.651) tests, respectively assessing strategy and planning, and working memory. According to these findings, the networks subserving bradykinesia and executive dysfunction in PD seems to be topographically distinct and to involve different aspects of subcortico-cortical processing.


Figures

Figure 1
Figure 1
Display of region weights for metabolic covariance pattern PC1, a PDRP‐like pattern. Regions having weights with absolute values >1 were chosen empirically as contributing significantly to pattern topography. Regional metabolic covariance pattern was identified in PET data from combined group including 15 non‐demented PD patients and 7 healthy, age‐matched subjects. Pattern‐related increases in the striatum and mediodorsal thalamus covaried with relative metabolic decreases in prefrontal and cingulate regions. Bottom left: Scatter diagram of the PC1 subject scores for Controls (filled diamond) and PD patients (filled triangle). Mean control value (open diamond) and mean patient value (open triangle) are represented with subgroup SD, indicated with error bars. Control group subject scores for the SSM network were offset to a mean of zero so that individual subject scores for PD patient were interpreted relative to an adjusted metabolic baseline defined by the subject scores of control group. DorsolatF_L, left dorsolateral prefrontal cortex; OrbitolatF_L, left orbitofrontal cortex; VtrMF_R, right ventromedial frontal cortex; Precent_L, left precentral gyrus; Postcent_L, left postcentral gyrus; Temporal_L, left temporal lobe; Temporal_R, right temporal lobe; HippocG_L, left para‐hippocampal and hippocampal area; HippocG_R, right para‐hippocampal and hippocampal area; Parietal_L, left parietal lobe; Caudate_L, left caudate nucleus; Caudate_R, right caudate nucleus; Putamen_L, left putamen; Putamen_R, right putamen; Pallidum_L, left pallidum; Pallidum_R, right pallidum; MD_L, left mediodorsal thalamus; MD_R, right mediodorsal thalamus; AntCingG, anterior cingulate gyrus; PostCingG, posterior cingulate gyrus (see Methods for details on these anatomic‐functional regions).
Figure 2
Figure 2
Scatterplots of patient PC1 subject scores vs. global motor scores as rated by the Columbia modified scale. Correlations were statistically significant by nonparametric Spearman rank test (P = 0.016, r = 0.640).
Figure 3
Figure 3
Display of region weights for metabolic covariance pattern PC2. Regions having weights with absolute values >1 were chosen empirically as contributing significantly to pattern topography Regional metabolic covariance pattern was identified in PET data from combined group including 15 non‐demented PD patients and 7 healthy, age‐matched subjects. Pattern‐related increases in the pallidum and mediodorsal thalamus covaried with relative metabolic decreases in ventromedial frontal regions and hippocampal gyrus. Inset: Scatter diagram of the PC2 subject scores for Controls (filled diamond‐shaped) and PD patients (filled triangle). Mean control value (open diamond) and mean patient value (open triangle) are represented with subgroup SDs, indicated with error bars. Control group subject scores for the SSM network were offset to a mean of zero so that individual subject scores for PD patient were interpreted relative to an adjusted metabolic baseline defined by the subject scores of control group. VtrMF_L, left ventromedial frontal cortex; VtrMF_R, right ventromedial frontal cortex; HippocG_L, left para‐hippocampal and hippocampal area; Caudate_L, left caudate nucleus; Caudate_R, right caudate nucleus; Putamen_L, left putamen; Putamen_R, right putamen; Pallidum_L, left pallidum; MD_L, left mediodorsal thalamus; MD_R, right mediodorsal thalamus.
Figure 4
Figure 4
Scatterplots of individual PC2 subject scores vs. CALeprc error scores (A) and BP3 performance (B) for the group of PD patients (n = 15). Both correlations were statistically significant by nonparametric Spearman rank test (P = 0.005, r = 0.744 and P = 0.017, r = −0.651, respectively).

References

    1. Alexander GE, Crutcher MD, DeLong MR (1990): Basal ganglia‐thalamocortical circuits: parallel substrates for motor, oculomotor, “prefrontal” and “limbic” functions. Prog Brain Res 85: 119–146. - PubMed
    1. Allain P, Travere JM, Baron JC, Bloyet D (1992): Multimodal analysis of brain images by superimposition of information from PET, 3‐D‐RMI and atlas data bases. Acta Stereologica, Proceedings of the Eighth International Congress for Stereology. 11: 181–185.
    1. Baddeley A (2000): The episodic buffer: a new component of working memory? Trends Cogn Sci 4: 417–423. - PubMed
    1. Bernheimer H, Birkmayer W, Hornykiewicz O, Jellinger K, Seitelberger F (1973): Brain dopamine and the syndromes of Parkinson and Huntington. Clinical, morphological and neurochemical correlations. J Neurol Sci 20: 415–455. - PubMed
    1. Brück A, Portin R, Lindell A, Laihinen A, Bergman J, Haaparanta M, Solin O, Rinne JO (2001): Positron emission tomography shows that impaired frontal lobe functioning in Parkinson's disease is related to dopaminergic hypofunction in the caudate nucleus. Neurosci Lett 311: 81–84. - PubMed

Publication types

MeSH terms

Substances