

The tetraspanin CD9 is preferentially expressed on the human CD4(+)CD45RA+ naive T cell population and is involved in T cell activation
- PMID: 15196249
- PMCID: PMC1809091
- DOI: 10.1111/j.1365-2249.2004.02494.x
The tetraspanin CD9 is preferentially expressed on the human CD4(+)CD45RA+ naive T cell population and is involved in T cell activation
Abstract
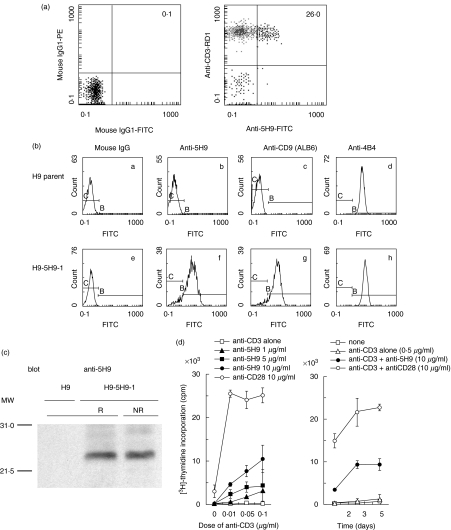
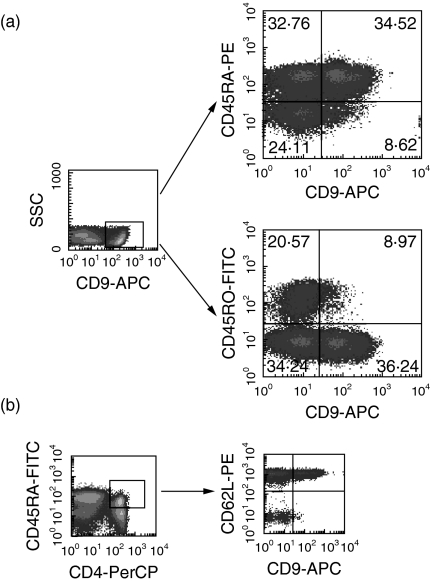
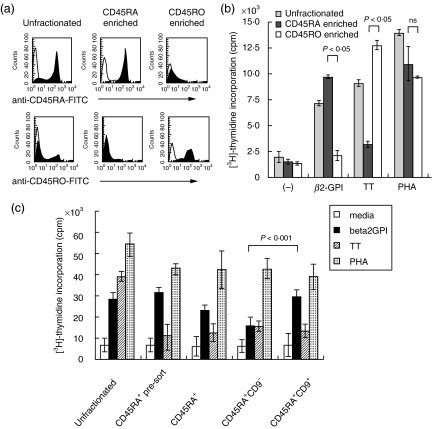
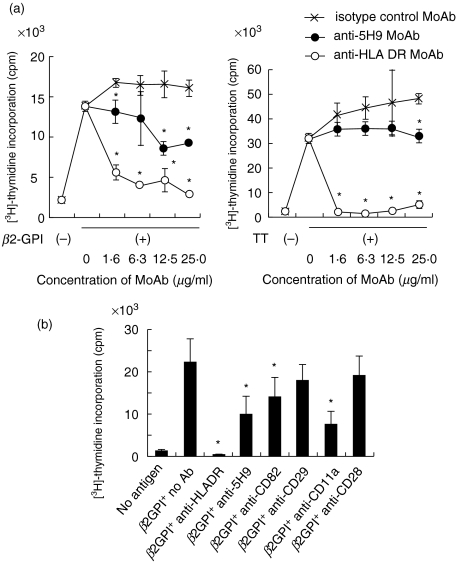
Human CD4+ T cells can be divided into reciprocal memory and naive T cell subsets based on their expression of CD45 isoforms and CD29/integrin beta1 subunit. To identify unique cell surface molecules on human T cells, we developed a new monoclonal antibody termed anti5H9. Binding of anti5H9 triggers a co-stimulatory response in human peripheral blood T cells. Retrovirus-mediated expression cloning has revealed that the antigen recognized by anti5H9 is identical to the tetraspanin CD9. We now show that human CD9 is preferentially expressed on the CD4(+)CD45RA+ naive T cell subset, and that CD9(+)CD45RA+ T cells respond preferentially to the recombinant beta2-glycoprotein I, compared to CD9-CD45RA+ T cells. Furthermore, anti5H9 inhibits both the recombinant beta2-glycoprotein I- and the recall antigen tetanus toxoid-specific T cell proliferation. These results suggest that the tetraspanin CD9 plays an important role in T cell activation.
Figures
Similar articles
-
Modulation of CD4 lateral interaction with lymphocyte surface molecules induced by HIV-1 gp120.Eur J Immunol. 1995 May;25(5):1306-11. doi: 10.1002/eji.1830250526. Eur J Immunol. 1995. PMID: 7539755
-
CD31, a novel cell surface marker for CD4 cells of suppressor lineage, unaltered by state of activation.J Immunol. 1992 Jan 15;148(2):388-96. J Immunol. 1992. PMID: 1345920
-
P. Rambotti Lecture. Human naive and memory T cells revisited: new markers (CD31 and CD27) that help define CD4+ T cell subsets.Clin Exp Rheumatol. 1993 May-Jun;11(3):241-7. Clin Exp Rheumatol. 1993. PMID: 8394793 Review.
-
In vitro responses of human CD45R0brightRA- and CD45R0-RAbright T cell subsets and their relationship to memory and naive T cells.Eur J Immunol. 1997 Sep;27(9):2383-90. doi: 10.1002/eji.1830270937. Eur J Immunol. 1997. PMID: 9341784
-
Isoforms of the CD45 common leukocyte antigen family: markers for human T-cell differentiation.J Clin Immunol. 1992 Jan;12(1):1-10. doi: 10.1007/BF00918266. J Clin Immunol. 1992. PMID: 1532395 Review.
Cited by
-
Molecular signatures induced by interleukin-2 on peripheral blood mononuclear cells and T cell subsets.J Transl Med. 2006 Jun 28;4:26. doi: 10.1186/1479-5876-4-26. J Transl Med. 2006. PMID: 16805915 Free PMC article.
-
A novel myeloid cell in murine spleen defined through gene profiling.J Cell Mol Med. 2019 Aug;23(8):5128-5143. doi: 10.1111/jcmm.14382. Epub 2019 Jun 18. J Cell Mol Med. 2019. PMID: 31210415 Free PMC article.
-
Tuned activation of MSLN-CAR T cells induces superior antitumor responses in ovarian cancer models.J Immunother Cancer. 2023 Feb;11(2):e005691. doi: 10.1136/jitc-2022-005691. J Immunother Cancer. 2023. PMID: 36746513 Free PMC article.
-
CD9 in acute myeloid leukemia: Prognostic role and usefulness to target leukemic stem cells.Cancer Med. 2019 Mar;8(3):1279-1288. doi: 10.1002/cam4.2007. Epub 2019 Feb 10. Cancer Med. 2019. PMID: 30740913 Free PMC article.
-
Single-cell analysis reveals islet autoantigen's immune activation in type 1 diabetes patients.J Clin Biochem Nutr. 2025 Jan;76(1):64-84. doi: 10.3164/jcbn.24-86. Epub 2024 Aug 29. J Clin Biochem Nutr. 2025. PMID: 39896168 Free PMC article.
References
-
- Morimoto C, Letvin NL, Boyd AW, et al. The isolation and characterization of the human helper inducer T cell subset. J Immunol. 1985;134:3762–9. - PubMed
-
- Morimoto C, Letvin NL, Distaso JA, Aldrich WR, Schlossman SF. The isolation and characterization of the human suppressor inducer T cell subset. J Immunol. 1985;134:1508–15. - PubMed
-
- Takeuchi T, Schlossman SF, Morimoto C. The T4 molecule differentially regulating the activation of subpopulations of T4+ cells. J Immunol. 1987;139:665–71. - PubMed
Publication types
MeSH terms
Substances
Grants and funding
LinkOut - more resources
Full Text Sources
Other Literature Sources
Molecular Biology Databases
Research Materials
Miscellaneous
