. 2004 Jul;124(1):43-57.
doi: 10.1085/jgp.200409067. Epub 2004 Jun 14.

Unique inner pore properties of BK channels revealed by quaternary ammonium block

Affiliations

Unique inner pore properties of BK channels revealed by quaternary ammonium block

Weiyan Li et al. J Gen Physiol. 2004 Jul.

Abstract

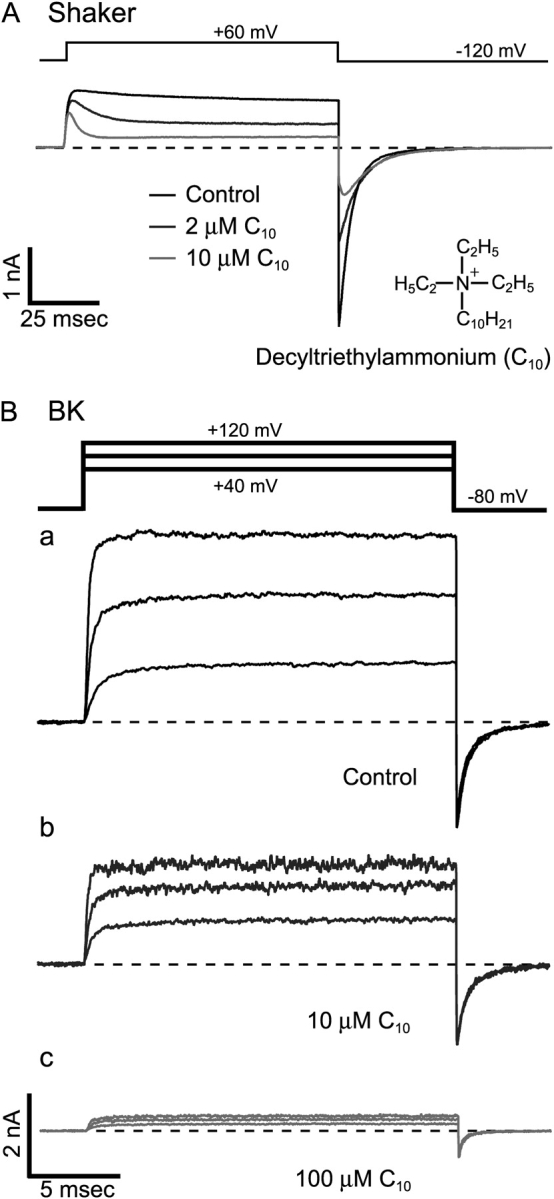
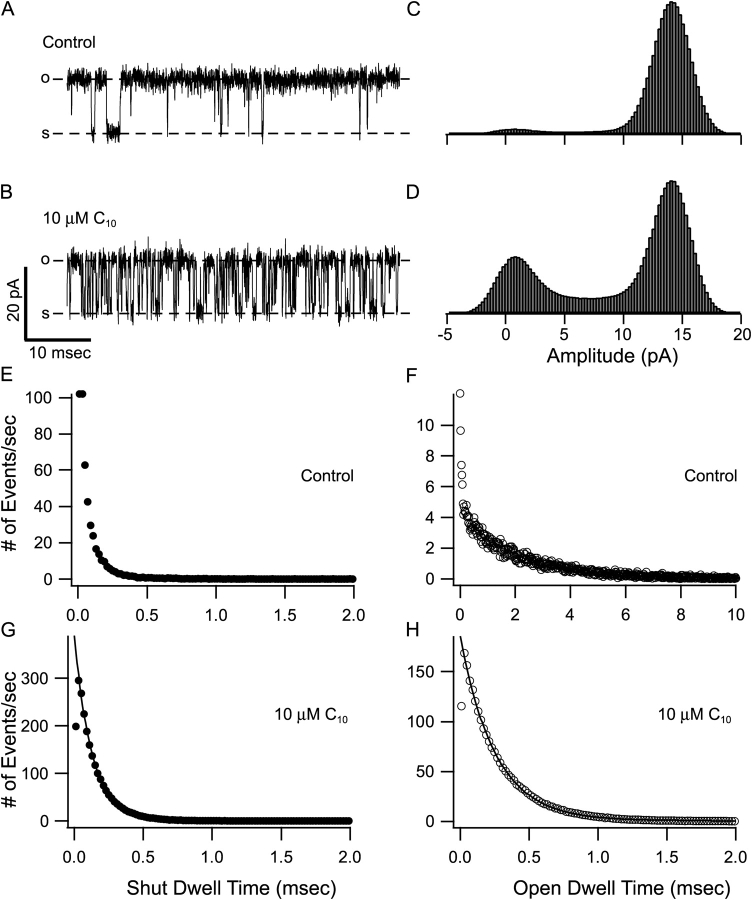
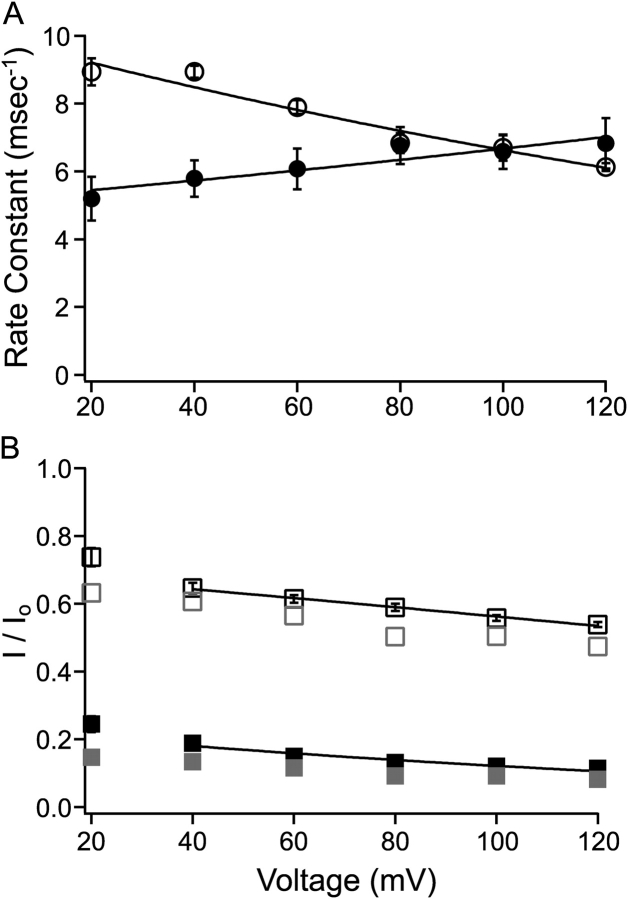
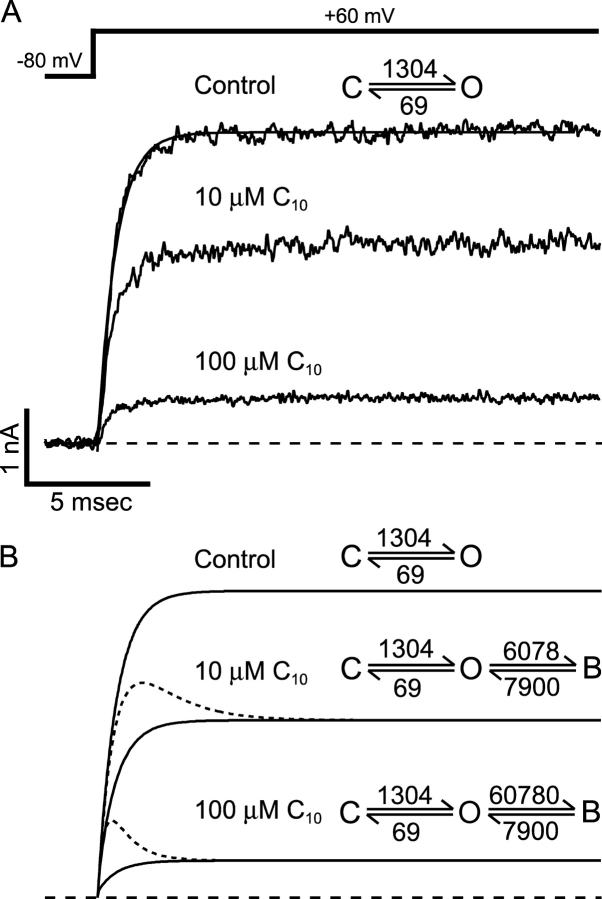
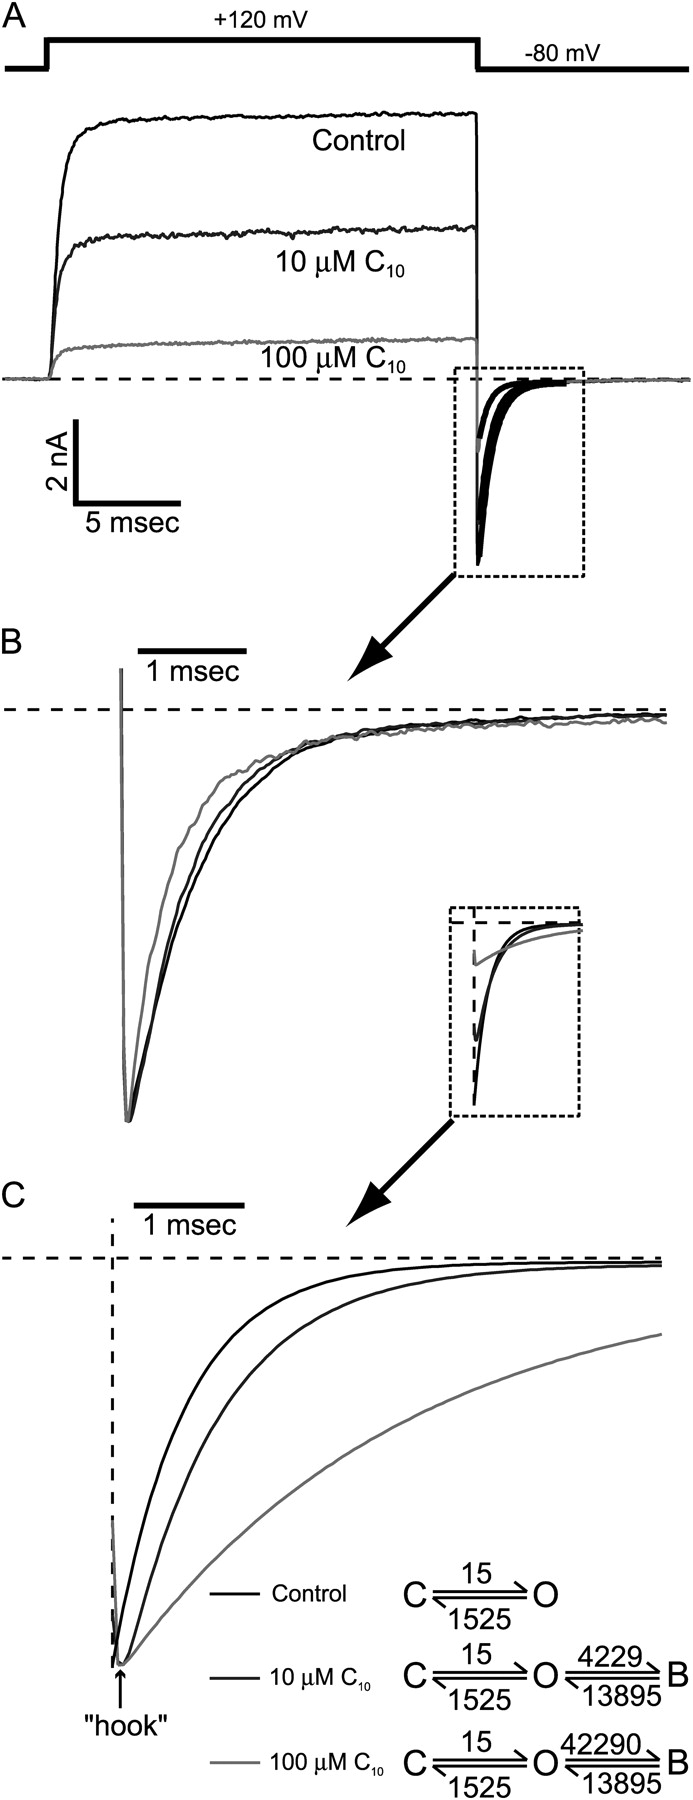
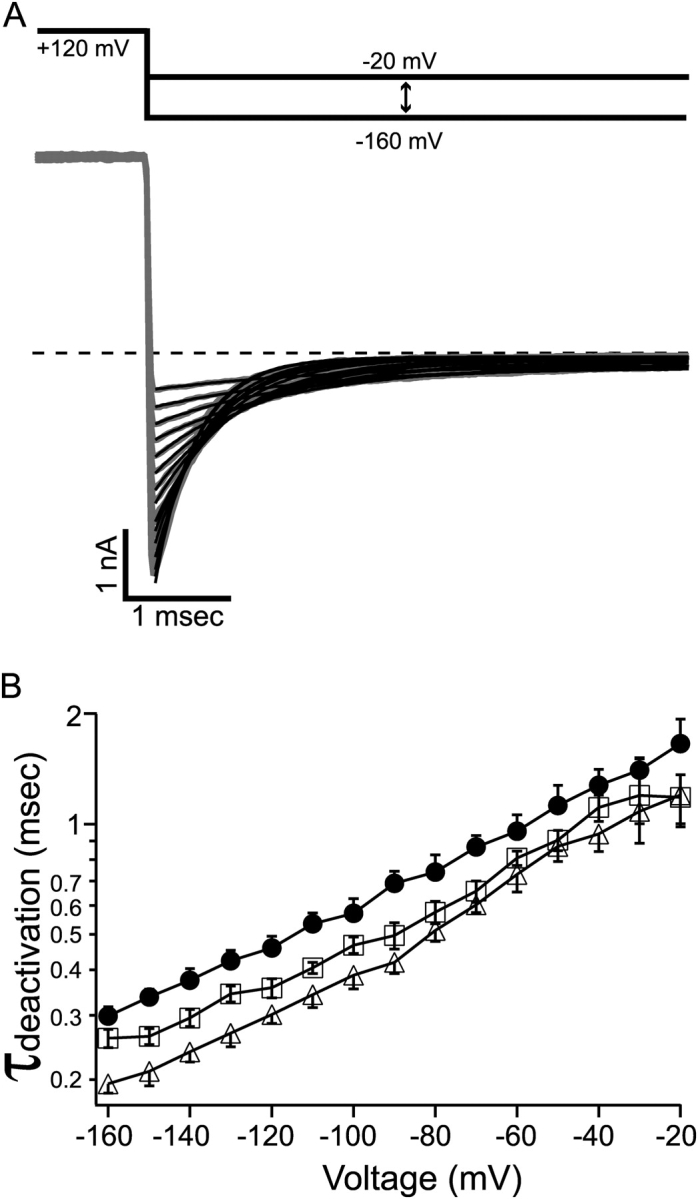
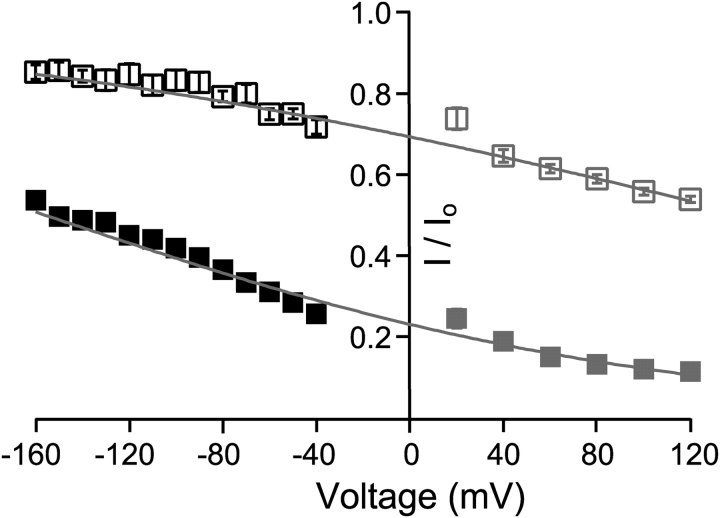
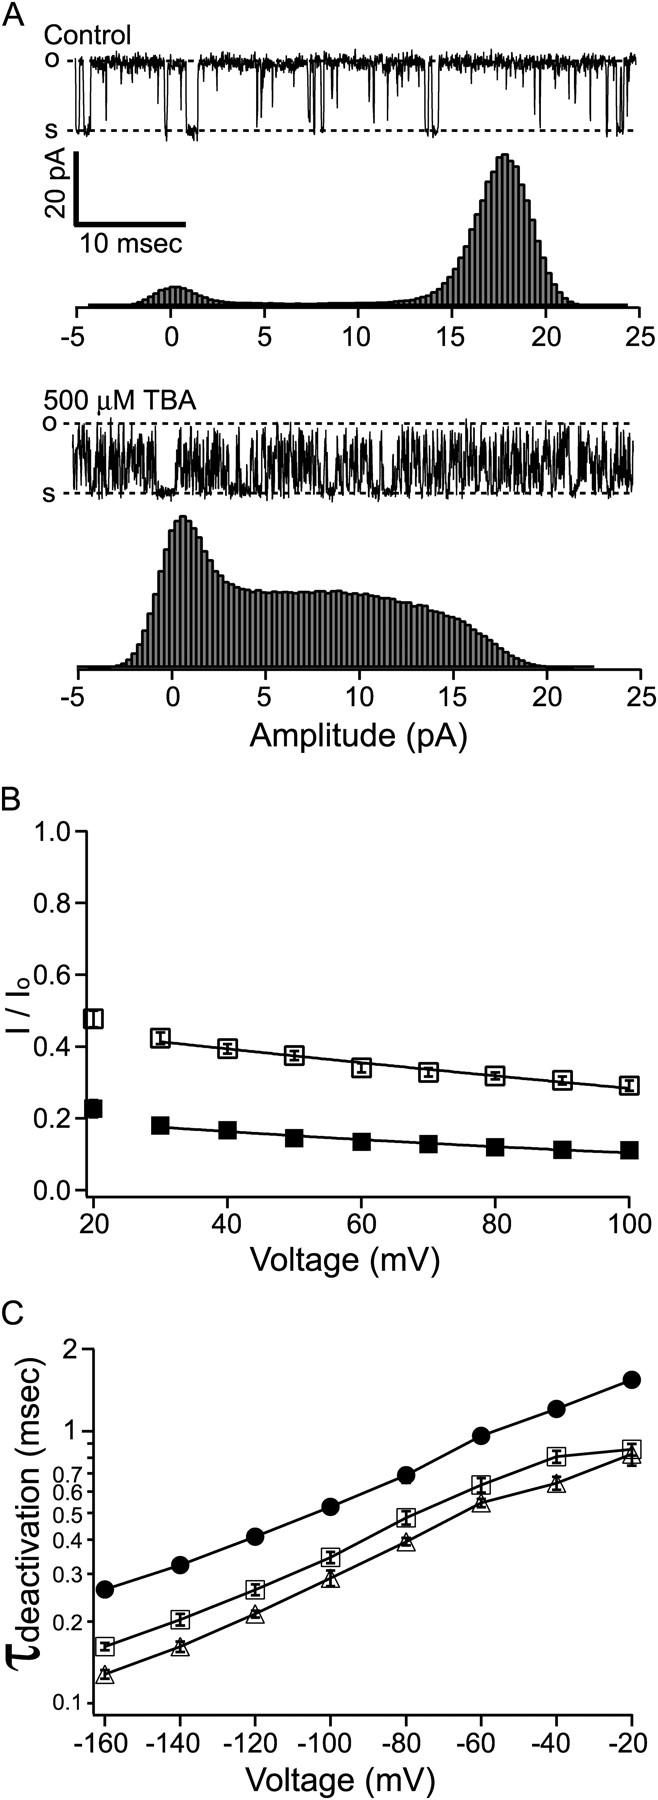
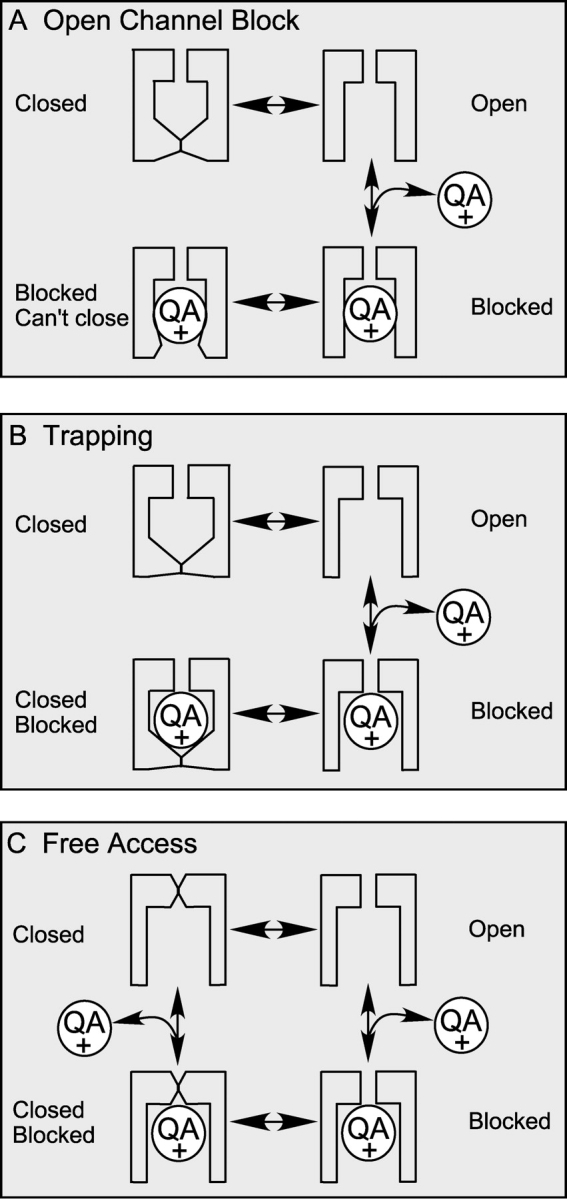
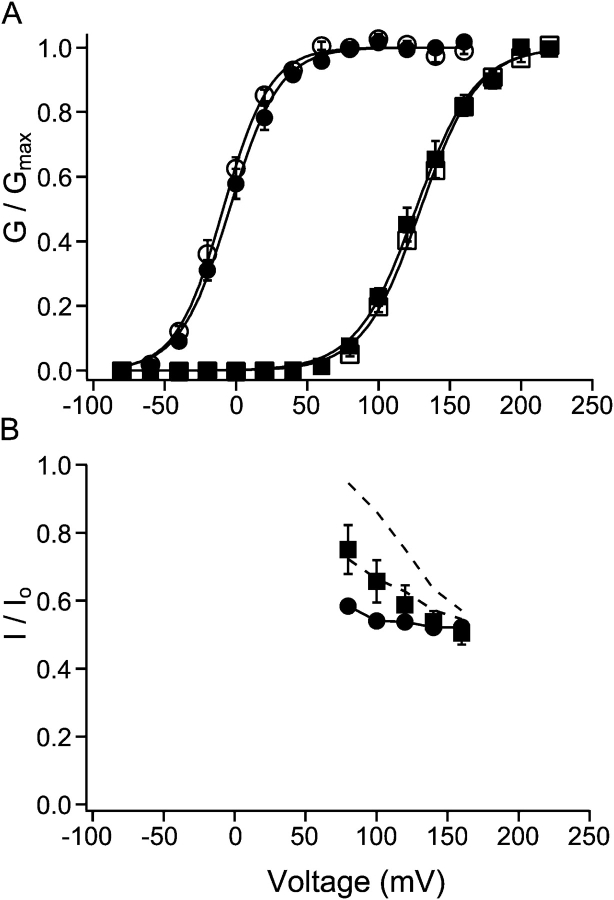
Potassium channels have a very wide distribution of single-channel conductance, with BK type Ca(2+)-activated K(+) channels having by far the largest. Even though crystallographic views of K(+) channel pores have become available, the structural basis underlying BK channels' large conductance has not been completely understood. In this study we use intracellularly applied quaternary ammonium compounds to probe the pore of BK channels. We show that molecules as large as decyltriethylammonium (C(10)) and tetrabutylammonium (TBA) have much faster block and unblock rates in BK channels when compared with any other tested K(+) channel types. Additionally, our results suggest that at repolarization large QA molecules may be trapped inside blocked BK channels without slowing the overall process of deactivation. Based on these findings we propose that BK channels may differ from other K(+) channels in its geometrical design at the inner mouth, with an enlarged cavity and inner pore providing less spatially restricted access to the cytoplasmic solution. These features could potentially contribute to the large conductance of BK channels.


Figures

F<sc>igure</sc> 1.
Figure 1.
No time dependence in the blockage of BK currents by C10. (A) Time-dependent block of Shaker K+ channels by C10. Macroscopic K+ currents were recorded from an inside-out patch from an oocyte expressing Shaker B Δ6-46 channels. Under voltage clamp, currents were elicited by depolarization of the membrane potential to 60 mV from a holding potential at −120 mV. Application of 2 μM (dark gray trace) and 10 μM C10 (light gray trace) resulted in reductions of current from the control level (black trace). (B) Macroscopic K+ currents carried by BK channels and their responses to C10. Currents were recorded under voltage clamp from an inside-out patch from an oocyte expressing mslo BK channels. Currents were elicited by depolarizations of the membrane potential to 40, 80, and 120 mV from a holding potential at −80 mV. Currents before (black) and after the application of 10 μM (dark gray) and 100 μM C10 (light gray) are shown with the same scale in a, b, and c, respectively. Current traces in this and all other figures represent the average of 4–8 consecutive series. The dashed lines indicate the zero current level in this and all other figures with macroscopic current traces.
F<sc>igure</sc> 2.
Figure 2.
C10 block of BK currents demonstrates fast kinetics at single-channel level. A and B are representative segments of single BK currents before and after the application of 10 μM C10. Currents were recorded at 60 mV from an inside-out patch containing a single BK channel. The dashed lines labeled with “o” and “s” indicate open and shut levels. All-point amplitude histograms for 30 s of recording before and 100 s of recording after the application of 10 μM C10 are shown in C and D, respectively. Single-channel traces were idealized with half-amplitude threshold analysis. E and F show the distribution of shut and open dwell time from the idealization of 30 s of control record, while G and H from 100 s of record in the presence of 10 μM C10. For the ease of comparison, the y-axis in E–H was converted to number of events per second. Note the different x-axis scale in F. Data in G and H were each fitted (solid lines) with a single exponential function: y = Aexp(−x/τ) + b. Calculated dead time for half-amplitude threshold analysis at 10 kHz is 17.9 μs. Only dwell times >40 μs were used for fitting. Data in G were fitted with A = 389, b = 0.44 and τ = 127 μs. Data in H were fitted with A = 185, b = 0.45 and τ = 253 μs.
F<sc>igure</sc> 3.
Figure 3.
Single-channel kinetics corresponds with macroscopic measurements. (A) With the method shown in Fig. 2, on (filled circles) and off (open circles) rate constants for C10 block were determined at various membrane potentials from six inside-out patches, each containing a single BK channel. Each measurement was made from 60 to 100 s of single-channel recording, and each dwell time histogram included 120,000 to 250,000 events. Each point represents the mean ± SEM. Voltage dependence of the rate constants was fitted (solid lines) with Eq. 1 (see text). Values for the fitting in this figure are: k(0) = 5.18 ms−1, δ = 0.06 (block rate) and k(0) = 10.00 ms−1, δ = 0.10 (unblock rate). Rate constants measured at more negative potentials than 20 mV clearly deviated from the shown voltage dependence. For reasons specified in the text, those values were not shown or included in the fitting. (B) Remaining fractions of steady-state macroscopic BK currents in the presence of 10 (open black squares, n = 15) or 100 μM C10 (filled black squares, n = 6) are plotted against membrane potential. Error bars representing SEM are plotted with the mean values, but are often smaller than the symbols. Voltage dependence in the remaining fraction of macroscopic currents was fitted (solid lines) with Eq. 2 (see text). Values at 20 mV and below could not be measured reliably due to very small currents at these potentials, therefore they were not included in the fitting. Indeed the measurements at these potentials apparently deviate from the fitting of voltage dependence. Values used to fit the data are as following: K(0) = 22.6 μM, δ = 0.14 (10 μM C10) and K(0) = 29.9 μM and δ = 0.19 (100 μM C10). Gray symbols in B represent the predicted fraction of remaining steady-state currents with a two-state: O↔B blocking reaction using average on and off rates in A. Note in this prediction no dependence of block on open probability was taken into consideration. In the case of 100 μM C10, 10 times the on rate in 10 μM C10 was used.
F<sc>igure</sc> 4.
Figure 4.
Fast kinetics can account for the lack of time dependence in C10 block of BK channels. (A) An example of macroscopic BK currents before and after the application of 10 and 100 μM C10. Currents were elicited by depolarization of membrane potential to 60 mV from −80 mV under voltage clamp. The smooth line in A is the fit of the control trace to a single exponential function I = I max (1exp(−(tt 0)/τ)), where I max is the maximal current level, t 0 is the delay in the activation process (Cui et al., 1997), and τ is activation time constant. Values used for the fit are I max = 4.03 nA, t 0 = 89 μs, and τ =728 μs. If we assume a two-state activation process: C↔O with opening rate α and closing rate β, then (1/ τ) = α + β, and P o = α/(α + β). By assuming a P o of 0.95 at 60 mV we can calculate the values for the forward and backward rates: α = 1,304 s−1 and β = 69 s−1. (B) Gating parameters from A were used for the simulations of currents according to the open-channel block mechanism: C↔O↔B. Block and unblock rate constants are from mean values at 60 mV in Fig. 3 A. Parameters used in the simulations are shown on the top of each trace (solid lines). 10 times the on rate is used in the simulation of 100 μM C10. Dotted lines are simulations when both the block and unblock rates are decreased by 20-fold with the C↔O gating parameters remaining unchanged.
F<sc>igure</sc> 5.
Figure 5.
C10 does not slow down the deactivation of BK channels. (A) Macroscopic BK currents were recorded from an inside-out patch under voltage clamp. Membrane potential was first depolarized to 120 mV to open all the channels then repolarized to −80 mV. Control current is shown in black and currents in the presence of 10 and 100 μM C10 are shown in dark gray and light gray, respectively. All tail currents can be well fitted with a single exponential function (black traces in the dotted box). The time constants from the fitting are 649 μs (control), 545 μs (10 μM C10) and 450 μs (100 μM C10). (B) Tail currents within the dotted box in A are normalized to the same peak amplitude. (C) Simulations of tail currents according to the open-channel block mechanism: C↔O↔B. In control trace, if we assume a two-state deactivation process: C↔O with opening rate α and closing rate β, then (1/τ) = α + β, and P o = α/(α + β). With the time constant τ from the single exponential fitting and by assuming a P o of 0.01 at −80 mV, we can calculate the values for the forward and backward rates: α =15 s−1 and β =1,525 s−1. C10 block and unblock rate constants at −80 mV are extrapolated values based on the voltage dependence of rate constants in Fig. 3 A, because accurate measurements of rate constants were not possible at negative potentials. The initial conditions for simulations of tail currents were determined by the level of steady-state block at 120 mV. The simulations of tail currents in the presence of 10 and 100 μM C10 are shown in dark and light gray, together with the control trace (black) in the dotted box. 10 times the on rate was used for the simulation of 100 μM C10. Single exponential fitting (not depicted) of the simulated tail currents yielded time constants of 649 μs (control), 865 μs (10 μM C10), and 2.603 ms (100 μM C10). Normalized tail currents to the same peak amplitude clearly demonstrate the slowing in deactivation.
F<sc>igure</sc> 6.
Figure 6.
Deactivation of BK channel was speeded by C10 at all negative membrane potentials. (A) Macroscopic BK currents (gray traces) were recorded from an inside-out patch under voltage clamp. Membrane potential was first depolarized to 120 mV to open all the channels then repolarized to various levels between −160 and −20 mV at 10-mV steps. Tail currents at each potential were fitted with single exponential function (black lines). Tail currents in the presence of 10 or 100 μM C10 (not depicted) can also be well fitted with single exponential functions at all negative potentials. (B) Deactivation time constants as measured in A are shown for control (filled circles), 10 μM C10 (open squares), and 100 μM C10 (open triangles). Each point represents the mean and SEM determined from 6–8 patches. The measurements of deactivation time constants in the absence and presence of C10 are from the same patches. The lines connecting the data points have no physical meanings.
F<sc>igure</sc> 7.
Figure 7.
Reduction of peak tail currents suggests fast block at negative membrane potentials. Remaining fractions of steady-state currents shown in Fig. 3 B are replotted in gray (10 μM C10: open squares; 100 μM C10: filled squares), with the fitting of voltage dependence (gray lines) extrapolated into the negative membrane potentials. The black symbols are the remaining fractions of peak tail currents after the application of 10 μM (open squares) or 100 μM C10 (filled squares). Each data point represents the mean ± SEM determined from 6–7 patches. Note that error bars are often smaller than the symbols.
F<sc>igure</sc> 8.
Figure 8.
Block of BK channels by tetrabutylammonium (TBA). (A) Sample single-channel records before and after the application of 500 μM TBA (this concentration of TBA blocks ∼50% of steady-state current at 60 mV) are shown on top of all-point amplitude histograms, each constructed from 30 s of recording. The dashed lines labeled with “o” and “s” represent open and shut levels. Because the current rarely reaches the fully open level in the presence of TBA, the open level is determined from the control trace from the same patch. (B) Remaining fractions of steady-state macroscopic BK currents in the presence of 1 mM TBA (open squares) and 5 mM TBA (filled squares) are plotted against membrane potential. Each data point represents the mean ± SEM determined from 6–7 patches. Error bars are often smaller than the symbols. Voltage dependence of TBA block was fitted with Eq. 2 (solid lines) with [TBA] replacing [C10]. Data at 30 mV and above were included for the fitting, which yielded the following parameters: K(0) = 0.90 mM, δ = 0.21 (1 mM TBA) and K(0) = 1.37 mM, δ = 0.22 (5 mM TBA). (C) TBA speeds up the deactivation of BK channels. Tail currents at various negative potentials were fitted with single exponential functions as in Fig. 6. Deactivation time constants before (filled circles) and after the application of 1 mM (open squares) and 5 mM TBA (open triangles) are plotted against membrane potential. Each point represents the average from 6–7 patches. Most error bars representing SEM are smaller than the symbols. The lines connecting the data points have no physical meanings.
F<sc>igure</sc> 9.
Figure 9.
Classic open-channel block mechanism needs modification to account for the block of BK channels by QAs. (A) Classic open-channel block scheme, in which a blocked channel can't close until it is unblocked first. (B) The “trapping” scheme, in which the channel can close with a bound blocker by trapping it inside. In this model, the blocker cannot enter or leave a channel when it is closed. (C) “Free access” scheme, in which the accessibility of the blocker to its binding site is not dependent on the conformation of the channel gate. Channels can be blocked or unblocked in either open or closed conformation. However, this mechanism does not exclude differences in binding affinity or kinetics between closed and open conformation. Therefore, the block may not be truly “independent” on gating.
F<sc>igure</sc> 10.
Figure 10.
Dependence of steady-state block on open probability. (A) Relative conductance of macroscopic BK currents as a function of membrane potential. Membrane potential was depolarized to various levels followed by repolarization at −80 mV. To determine relative conductance at different potentials, amplitude of tail currents at 80 μs after the beginning of repolarization was measured and normalized to the maximum. Open and filled circles are data points with 110 μM Ca2+ in the internal solution before and after the application of 10 μM C10. Open and filled squares are data points with 0.85 μM Ca2+ in the internal solution before and after the application of 10 μM C10. Each point represents the mean ± SEM from six patches. Data with 110 and 0.85 μM Ca2+ were from the same patches. Each set of data were fitted (solid lines) with the Boltzmann function G=formula image and then normalized to the maximum of the fit. In this function V 1/2 is the membrane potential at which half of the channels are open, z is the apparent equivalent gating charge, while all other parameters have their normal meanings. Values used to fit the data are as following: 110 μM Ca2+: V 1/2 = −9.0 mV and z = 1.56 (before C10); V 1/2 = −4.4 mV and z = 1.46 (10 μM C10); 0.85 μM Ca2+: V 1/2 = 129.5 mV and z = 1.27 (before C10); V 1/2 = 126.3 mV and z = 1.23 (10 μM C10). (B) Remaining fractions of steady-state currents at various potentials in the presence of 10 μM C10 with either 110 (filled circles) or 0.85 μM Ca2+ (filled squares) in the internal solution. Each point represents the average from the same six patches in A, and the error bars are SEM. The solid line connecting filled circles has no physical meaning. The top dashed line is the prediction for 0.85 μM Ca2+ based on the C↔O↔B scheme, with true blocking equilibrium determined from level of block at 110 μM Ca2+ and open probability from A. The middle dashed line is the prediction for 0.85 μM Ca2+ based on the C↔O↔B↔BC scheme, with true blocking equilibrium determined from data at 110 μM Ca2+ and a factor of θ = 2 in the change of gating equilibrium when blocker is bound (see text for details).

Similar articles

Cited by

References

    1. Armstrong, C.M. 1969. Inactivation of the potassium conductance and related phenomena caused by quaternary ammonium ion injection in squid axons. J. Gen. Physiol. 54:553–575. - PMC - PubMed
    1. Armstrong, C.M. 1971. Interaction of tetraethylammonium ion derivatives with the potassium channels of giant axons. J. Gen. Physiol. 58:413–437. - PMC - PubMed
    1. Armstrong, C.M., and L. Binstock. 1965. Anomalous rectification in the squid giant axon injected with tetraethylammonium chloride. J. Gen. Physiol. 48:859–872. - PMC - PubMed
    1. Armstrong, C.M., and B. Hille. 1972. The inner quaternary ammonium ion receptor in potassium channels of the node of Ranvier. J. Gen. Physiol. 59:388–400. - PMC - PubMed
    1. Baukrowitz, T., and G. Yellen. 1996. a. Two functionally distinct subsites for the binding of internal blockers to the pore of voltage-activated K+ channels. Proc. Natl. Acad. Sci. USA. 93:13357–13361. - PMC - PubMed

Publication types

MeSH terms

Substances