. 2004 Jun 22;101(25):9297-302.
doi: 10.1073/pnas.0402592101. Epub 2004 Jun 14.

Exceptional record of mid-Pleistocene vertebrates helps differentiate climatic from anthropogenic ecosystem perturbations

Affiliations

Exceptional record of mid-Pleistocene vertebrates helps differentiate climatic from anthropogenic ecosystem perturbations

Anthony D Barnosky et al. Proc Natl Acad Sci U S A. .

Abstract

Mid-Pleistocene vertebrates in North America are scarce but important for recognizing the ecological effects of climatic change in the absence of humans. We report on a uniquely rich mid-Pleistocene vertebrate sequence from Porcupine Cave, Colorado, which records at least 127 species and the earliest appearances of 30 mammals and birds. By analyzing >20,000 mammal fossils in relation to modern species and independent climatic proxies, we determined how mammal communities reacted to presumed glacial-interglacial transitions between 1,000,000 and 600,000 years ago. We conclude that climatic warming primarily affected mammals of lower trophic and size categories, in contrast to documented human impacts on higher trophic and size categories historically. Despite changes in species composition and minor changes in small-mammal species richness evident at times of climatic change, overall structural stability of mammal communities persisted >600,000 years before human impacts.


Figures

Fig. 1.
Fig. 1.
Location of Porcupine Cave (small black dot) within Colorado. Circle shows 12.5-km radius around the cave. Base map is from ref. .
Fig. 2.
Fig. 2.
Relative percentages of small-mammal taxa (rodents and lagomorphs) through the Porcupine Cave Pit Sequence of Irvingtonian age. Inferred immigration events are indicated by letters (A, B, C, etc.), and extinctions are indicated by daggers. Within each genus or subfamily, multiple species are included (ref. and supporting information). See text for names of taxa involved in immigrations and extinctions. The Badger Room locality correlates to somewhere between levels 4 and 8 in the Pit Sequence. Inferred climatic intervals are shown as gray for interglacials and white for glacials. Asterisk indicates the percentage of total MNI per level for all taxa shown on the diagram. Sample sizes per level are listed at the left. NISP, number of identified specimens; MNI, minimumum number of individual animals.
Fig. 3.
Fig. 3.
Expected and observed species richness. (A) Expected species richness derived from Coleman rarefaction analysis plotted against actual species richness for stratigraphic levels of Porcupine Cave Pit Sequence that had numbers of identifiable specimens >300. The plot is for rodents and lagomorphs only. Each point represents a single stratigraphic level. Levels 6, 5, and 4 represent a climatic interval that is substantially cooler and moister than the interglacial represented by levels 3, 2, and 1. (B) Observed richness graphed as a function of time. Time proceeds from left to right; numbers indicate the stratigraphic level, H indicates historic time, and M indicates modern time as explained in Materials and Methods. The drop in richness from cool to interglacial times is particularly dramatic given that sample sizes are so much larger for the interglacial (see text and the sample-size listings in Fig. 2).
Fig. 4.
Fig. 4.
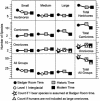
Numbers of species (vertical axis) observed in trophic and size categories (along horizontal axis) for various time intervals: Badger Room time, level 1, historic time (late 19th and early 20th centuries), and modern time (late 20th and early 21st centuries). See text for further explanation and Tables 1 and 2, ref. , and supporting information for data.

References

    1. Bell, C. J., Lundelius, E. L., Jr., Barnosky, A. D., Graham, R. W., Lindsay, E. H., Ruez, D. R., Jr., Semken, H. A., Jr., Webb, S. D. & Zakrzewski, R. J. (2004) in Late Cretaceous and Cenozoic Mammals of North America: Biostratigraphy and Geochronology, ed. Woodburne, M. O. (Columbia Univ. Press, New York), pp. 232-314.
    1. Lundelius, E. L., Jr., Downs, T., Lindsay, H. A., Semken, H. A., Jr., Zakrzewski, R. J., Churcher, C. S., Harington, C. R., Schultz, G. E. & Webb, S. D. (1987) in Cenozoic Mammals of North America, ed. Woodburne, M. O. (Univ. of California Press, Berkeley), pp. 211-235.
    1. FAUNMAP Working Group (1996) Science 272, 1601-1606. - PubMed
    1. Martin, P. S. & Klein, R. G. (1984) Quaternary Extinctions: A Prehistoric Revolution (Univ. of Arizona Press, Tucson).
    1. Alroy, J. (2001) Science 292, 1893-1896. - PubMed

Publication types