

Spatial synchrony of local populations has increased in association with the recent Northern Hemisphere climate trend
- PMID: 15197267
- PMCID: PMC438969
- DOI: 10.1073/pnas.0305029101
Spatial synchrony of local populations has increased in association with the recent Northern Hemisphere climate trend
Abstract
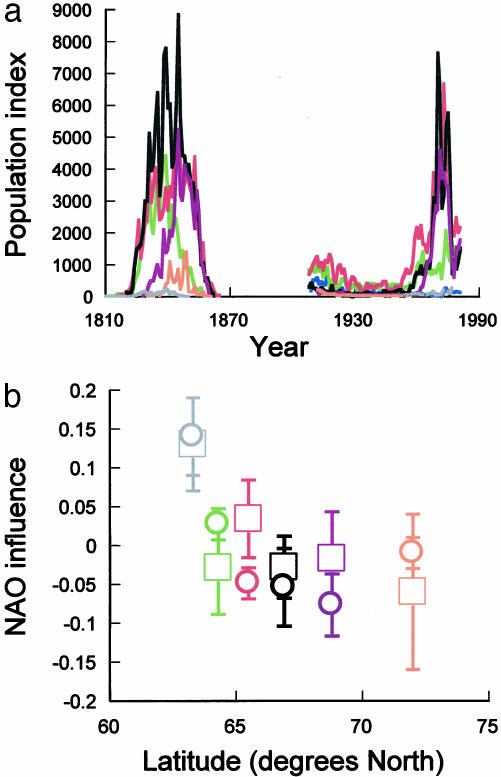
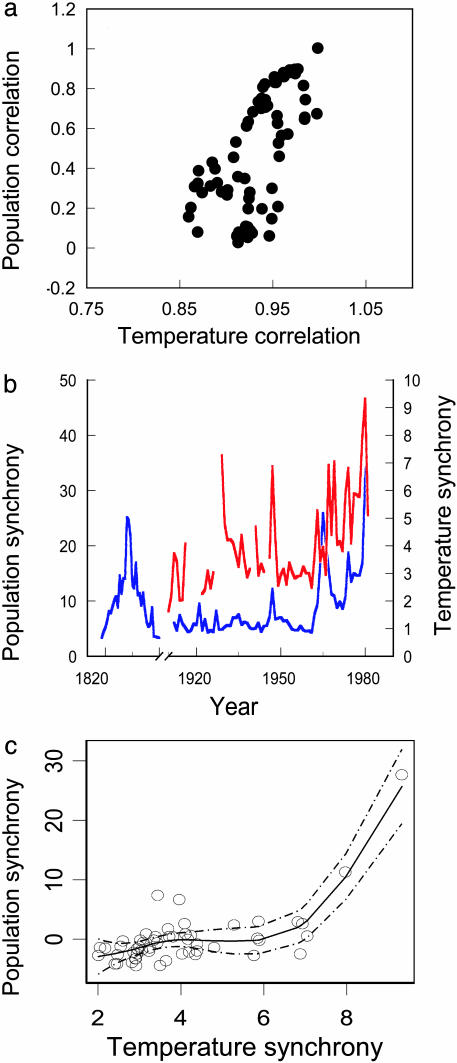
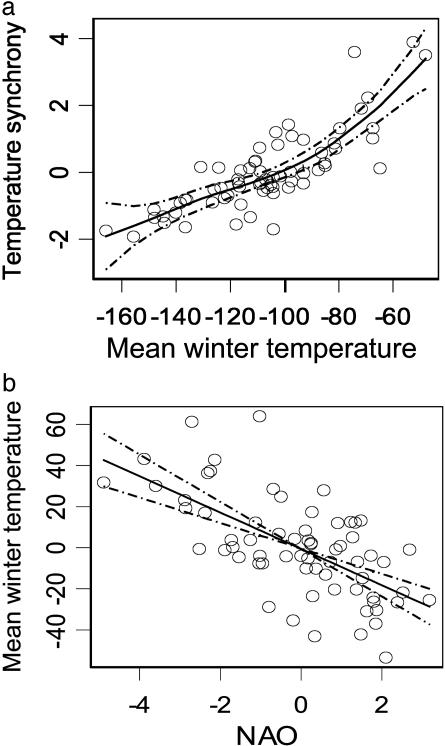
According to ecological theory, populations whose dynamics are entrained by environmental correlation face increased extinction risk as environmental conditions become more synchronized spatially. This prediction is highly relevant to the study of ecological consequences of climate change. Recent empirical studies have indicated, for example, that large-scale climate synchronizes trophic interactions and population dynamics over broad spatial scales in freshwater and terrestrial systems. Here, we present an analysis of century-scale, spatially replicated data on local weather and the population dynamics of caribou in Greenland. Our results indicate that spatial autocorrelation in local weather has increased with large-scale climatic warming. This increase in spatial synchrony of environmental conditions has been matched, in turn, by an increase in the spatial synchrony of local caribou populations toward the end of the 20th century. Our results indicate that spatial synchrony in environmental conditions and the populations influenced by them are highly variable through time and can increase with climatic warming. We suggest that if future warming can increase population synchrony, it may also increase extinction risk.
Figures
References
-
- Walther, G.-R., Post, E., Convey, P., Menzel, A., Parmesan, C., Beebee, T. J. C., Fromentin, J.-M., Guldberg, O. H. & Bairlein, F. (2002) Nature 416, 389-395. - PubMed
-
- Root, T. L., Price, J. T., Hall, K. R., Schneider, S. H., Rosenzweig, C. A. & Pounds, J. A. (2003) Nature 421, 57-60. - PubMed
-
- McCarthy, J. J., Canziani, O. F., Leary, N. A., Dokken, D. J. & White, K. S., eds. (2001) Climate Change 2001: Impacts, Adaptation, and Vulnerability (Cambridge Univ. Press, Cambridge, U.K.).
-
- Houghton, J. T., Ding, Y., Griggs, D. J., Noguer, M., van der Linden, P. J., Dai, X., Maskell, K. & Johnson, C. A., eds. (2001) Climate Change 2001: The Scientific Basis (Cambridge Univ. Press, Cambridge, U.K.).
-
- Sparks, T. H. & Carey, P. D. (1995) J. Ecol. 83, 321-329.
Publication types
MeSH terms
LinkOut - more resources
Full Text Sources
