Fluorescence lifetime imaging
- PMID: 1519759
- PMCID: PMC6986422
- DOI: 10.1016/0003-2697(92)90112-k
Fluorescence lifetime imaging
Abstract
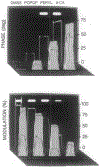
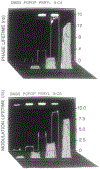
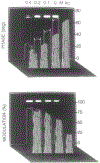
We describe a new fluorescence imaging methodology in which the image contrast is derived from the fluorescence lifetime at each point in a two-dimensional image and not the local concentration and/or intensity of the fluorophore. In the present apparatus, lifetime images are created from a series of images obtained with a gain-modulated image intensifier. The frequency of gain modulation is at the light-modulation frequency (or a harmonic thereof), resulting in homodyne phase-sensitive images. These stationary phase-sensitive images are collected using a slow-scan CCD camera. A series of such images, obtained with various phase shifts of the gain-modulation signal, is used to determine the phase angle and/or modulation of the emission at each pixel, which is in essence the phase or modulation lifetime image. An advantage of this method is that pixel-to-pixel scanning is not required to obtain the images, as the information from all pixels is obtained at the same time. The method has been experimentally verified by creating lifetime images of standard fluorophores with known lifetimes, ranging from 1 to 10 ns. As an example of biochemical imaging we created life-time images of Yt-base when quenched by acrylamide, as a model for a fluorophore in distinct environments that affect its decay time. Additionally, we describe a faster imaging procedure that allows images in which a specific decay time is suppressed to be calculated, allowing rapid visualization of unique features and/or regions with distinct decay times. The concepts and methodologies of fluorescence lifetime imaging (FLIM) have numerous potential applications in the biosciences. Fluorescence lifetimes are known to be sensitive to numerous chemical and physical factors such as pH, oxygen, temperature, cations, polarity, and binding to macromolecules. Hence the FLIM method allows chemical or physical imaging of macroscopic and microscopic samples.
Figures


Similar articles
-
Fluorescence lifetime imaging of free and protein-bound NADH.Proc Natl Acad Sci U S A. 1992 Feb 15;89(4):1271-5. doi: 10.1073/pnas.89.4.1271. Proc Natl Acad Sci U S A. 1992. PMID: 1741380 Free PMC article.
-
Fluorescence lifetime imaging of intracellular calcium.J Fluoresc. 1993 Sep;3(3):161-7. doi: 10.1007/BF00862736. J Fluoresc. 1993. PMID: 24234827
-
Fluorescence lifetime imaging of calcium using Quin-2.Cell Calcium. 1992 Mar;13(3):131-47. doi: 10.1016/0143-4160(92)90041-p. Cell Calcium. 1992. PMID: 1576634 Free PMC article.
-
Fluorescence lifetime imaging--techniques and applications.J Microsc. 2012 Aug;247(2):119-36. doi: 10.1111/j.1365-2818.2012.03618.x. Epub 2012 May 24. J Microsc. 2012. PMID: 22621335 Review.
-
[Fluorescence lifetime imaging microscopy (FLIM) in biological and medical research].Postepy Biochem. 2009;55(4):434-40. Postepy Biochem. 2009. PMID: 20201357 Review. Polish.
Cited by
-
Fluorescence microscopy shadow imaging for neuroscience.Front Cell Neurosci. 2024 Feb 15;18:1330100. doi: 10.3389/fncel.2024.1330100. eCollection 2024. Front Cell Neurosci. 2024. PMID: 38425431 Free PMC article. Review.
-
Biological Deep Temperature Imaging with Fluorescence Lifetime of Rare-Earth-Doped Ceramics Particles in the Second NIR Biological Window.Sci Rep. 2019 Sep 5;9(1):12806. doi: 10.1038/s41598-019-49291-x. Sci Rep. 2019. PMID: 31488857 Free PMC article.
-
Resonances at Fundamental and Harmonic Frequencies for Selective Imaging of Sine-Wave Illuminated Reversibly Photoactivatable Labels.Chemphyschem. 2022 Dec 5;23(23):e202200295. doi: 10.1002/cphc.202200295. Epub 2022 Sep 21. Chemphyschem. 2022. PMID: 35976176 Free PMC article.
-
Fluorescence intensity and anisotropy decay of the 4',6-diamidino-2-phenylindole-DNA complex resulting from one-photon and two-photon excitation.J Fluoresc. 1992 Jun;2(2):117-22. doi: 10.1007/BF00867671. J Fluoresc. 1992. PMID: 24243275
-
Fluorescence lifetime imaging nanoscopy for measuring Förster resonance energy transfer in cellular nanodomains.Neurophotonics. 2019 Jan;6(1):015002. doi: 10.1117/1.NPh.6.1.015002. Epub 2019 Jan 31. Neurophotonics. 2019. PMID: 30746389 Free PMC article.
References
-
- Dewey TG (Ed.). (1991) Biophysical and Biochemical Aspects of Fluorescence Spectroscopy, Plenum Press, New York.
-
- Jameson DM, and Reinhart G (1989) Fluorescent Biomolecules, Plenum Press, New York.
-
- Lakowicz JR (1983) Principles of Fluorescence Spectroscopy, Plenum Press, New York.
-
- Lakowicz JR (Ed.). (1990) Time-Resolved Laser Spectroscopy in Biochemistry, II, SPIE Press, Billingham, WA.
-
- Demchenko AP (1986) Ultraviolet Spectroscopy of Proteins, Springer-Verlag, Berlin.
Publication types
MeSH terms
Grants and funding
LinkOut - more resources
Full Text Sources
Other Literature Sources
Research Materials
Miscellaneous

