. 2004 Aug;75(2):267-81.
doi: 10.1086/422854. Epub 2004 Jun 11.

High-resolution molecular characterization of 15q11-q13 rearrangements by array comparative genomic hybridization (array CGH) with detection of gene dosage

Affiliations

High-resolution molecular characterization of 15q11-q13 rearrangements by array comparative genomic hybridization (array CGH) with detection of gene dosage

Nicholas J Wang et al. Am J Hum Genet. 2004 Aug.

Abstract

Maternally derived duplication of the imprinted region of chromosome 15q11-q14 leads to a complex neurobehavioral phenotype that often includes autism, cognitive deficits, and seizures. Multiple repeat elements within the region mediate a variety of rearrangements, including interstitial duplications, interstitial triplications, and supernumerary isodicentric marker chromosomes, as well as the deletions that cause Prader-Willi and Angelman syndromes. To elucidate the molecular structure of these duplication chromosomes, we designed a high-resolution array comparative genomic hybridization (array CGH) platform. The array contains 79 clones that form a gapped contig across the critical region on chromosome 15q11-q14 and 21 control clones from other autosomes and the sex chromosomes. We used this array to examine a set of 48 samples from patients with segmental aneuploidy of chromosome 15q. Using the array, we were able to determine accurately the dosage, which ranged from 1 to 6 copies, and also to detect atypical and asymmetric rearrangements. In addition, the increased resolution of the array allowed us to position two previously reported breakpoints within the contig. These results indicate that array CGH is a powerful technique to study rearrangements of proximal chromosome 15q.


Figures
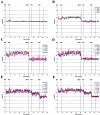
Figure  A1
Figure A1
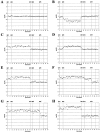
The log2 T/R ratio array data for patients studied. A, The average log2 T/R ratios for the combined data from five control experiments. Error bars represent ±1 SD. B, The log2 T/R ratios for four patients with interstitial duplications involving a BP1:BP3B recombination event. C and D, Plots of the log2 T/R ratio for the 13 patients carrying an SMC(15) that arose from a symmetrical BP3:BP3 recombination event leading to tetrasomy for the duplicated region. The data were split onto two graphs to facilitate discrimination of the curves. E and F, Data from the remaining 16 patients that carried an asymmetrical SMC(15) that resulted from a BP4:BP5 recombination event leading to tetrasomy proximal to BP4 and trisomy between BP4 and BP5. Again, the data were split arbitrarily onto two graphs to allow better discrimination of the individual lines.
Figure  1
Figure 1
Gapped contig of the clones spotted on the array covering chromosome 15q11-q14. Black bars signify locations of designated clones on chromosome 15q11-q14, and gray bars/boxes represent sequenced regions not represented on the array. Unblackened boxes indicate gaps in the genomic sequence where no clones have been placed. The relative positions of the known breakpoints are indicated. Array clones derived from non–chromosome 15 autosomes, sex chromosomes, and P1 FISH clones are not shown.
Figure  2
Figure 2
The log2 T/R ratio plots for control samples representing various forms of segmental rearrangements of chromosome 15q11-q14. A, Cytogenetically normal control. B, Patient GM-11385 with PWS and a BP2:BP3A deletion. C, Interstitial duplication event between BP1 and BP3B, leading to trisomy in patient 98-19. D, Interstitial duplication between BP2 and BP3A, leading to trisomy in patient 99-9. E, Supernumerary SMC(15) with a BP3B:BP3B junction in patient 03-71, leading to tetrasomy for the involved regions. F, SMC(15) with an asymmetric BP4:BP5 junction in patient 99-70. G, SMC(15) with a BP5:BP5 junction in patient 99-73. H, SMC(15) resulting in partial hexasomy of chromosome 15q11-q14 in patient 00-29. In the plots, only the clones representing chromosome 15q11-q14 are shown. A ratio >0.3 indicated a gain of DNA copy number for the clone, whereas a ratio <−0.3 indicated a loss of DNA copy number. The vertical lines represent the locations of breakpoints, as determined by our array analysis and by published reports. BP3A is not shown but lies between spots 49 and 50.
Figure  3
Figure  3
Standard curve of log2 T/R ratios. The observed ratios for each copy number are represented by blackened squares (±1 SD), with a corresponding trend line. The gray dashed line represents theoretical values at a given copy number (gray diamonds).
Figure  4
Figure 4
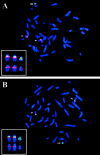
Mapping of BP5 by metaphase FISH of patient 03-28. Chromosome 15 homologs are marked by an arrowhead, and the SMC(15) is marked by an arrow. Enlargements of the images are inset, with the top row showing dual color hybridization and the bottom-row red signal arising from the BAC clone. A, Red signals represent clone AC124094 (spot 73), and green signals represent pcm15 (chromosome 15 centromere). Hybridization of AC124094 is seen on the normal homologs and on the SMC(15), with a weaker signal on the SMC(15). B, Red signals represent AC074201 (spot 74), and the green signals represent pcm15. Clone AC074201 hybridizes to the normal chromosome 15 homologs but not to the SMC(15). These data place the breakpoint within clone AC124094, which is consistent with its intermediate fluorescence signal on the array.
Figure  5
Figure 5
Characterization of deletions in patients 00-3 and 99-36 by FISH. Array data charts for 00-3 (A) and 99-36 (B) show a relative decrease in signal intensity for clones in the interval between BP1 and BP2. C, FISH analysis of the BP1–BP2 interval, with clone AC011767 (spot 5, red) and with pcm15 (green). The absence of hybridization of clone AC011767 to one chromosome 15 homolog in metaphase spreads from patient 00-3 was consistently detected, although two paired signals were present on the SMC(15). D, FISH with clone AC138649 (spot 6, red) and with pcm15 (green) on metaphase chromosomes from patient 00-3. Signals for the more telomeric clone, AC138649, were present on both chromosome 15 homologs. E, FISH with clone AC138649 (spot 6, red) and with pcm15 (green) on metaphase chromosomes from patient 99-36. The presence of a single paired signal on the SMC(15) for clone AC138649 indicates that there is only one copy of the region. F, FISH with a more distal clone, AC138687 (spot 8, red), and with pcm15 (green) generating a double signal from clone AC138687, consistent with two copies on the idic(15). C–F, Arrowheads indicate chromosome 15 homologs; arrows indicate the SMC(15). Enlargements of the images are inset, with the top row showing dual color hybridization and the bottom-row red signal arising from the BAC clone.

References

Electronic-Database Information

    1. BAC/PAC Resources Center, http://bacpac.chori.org (for BAC and PAC clones)
    1. Genome Database, http://www.gdb.org (for microsatellite markers)
    1. Online Mendelian Inheritance in Man (OMIM), http://www.ncbi.nlm.nih.gov/Omim/
    1. UCSC Genome Browser, http://genome.ucsc.edu (for clone positions)

References

    1. Amos-Landgraf JM, Ji Y, Gottlieb W, Depinet T, Wandstrat AE, Cassidy SB, Driscoll DJ, Rogan PK, Schwartz S, Nicholls RD (1999) Chromosome breakage in the Prader-Willi and Angelman syndromes involves recombination between large, transcribed repeats at proximal and distal breakpoints. Am J Hum Genet 65:370–386 - PMC - PubMed
    1. Browne CE, Dennis NR, Maher E, Long FL, Nicholson JC, Sillibourne J, Barber JC (1997) Inherited interstitial duplications of proximal 15q: genotype-phenotype correlations. Am J Hum Genet 61:1342–1352 - PMC - PubMed
    1. Bruder CE, Hirvela C, Tapia-Paez I, Fransson I, Segraves R, Hamilton G, Zhang XX, et al (2001) High resolution deletion analysis of constitutional DNA from neurofibromatosis type 2 (NF2) patients using microarray-CGH. Hum Mol Genet 10:271–28210.1093/hmg/10.3.271 - DOI - PubMed
    1. Buckley PG, Mantripragada KK, Benetkiewicz M, Tapia-Paez I, Diaz De Stahl T, Rosenquist M, Ali H, et al (2002) A full-coverage, high-resolution human chromosome 22 genomic microarray for clinical and research applications. Hum Mol Genet 11:3221–322910.1093/hmg/11.25.3221 - DOI - PubMed
    1. Butler MG, Bittel DC, Kibiryeva N, Talebizadeh Z, Thompson T (2004) Behavioral differences among subjects with Prader-Willi syndrome and type I or type II deletion and maternal disomy. Pediatrics 113:565–57310.1542/peds.113.3.565 - DOI - PMC - PubMed

Publication types

LinkOut - more resources