Interpreting posterior relative risk estimates in disease-mapping studies
- PMID: 15198922
- PMCID: PMC1247195
- DOI: 10.1289/ehp.6740
Interpreting posterior relative risk estimates in disease-mapping studies
Abstract
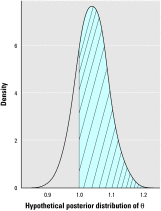
There is currently much interest in conducting spatial analyses of health outcomes at the small-area scale. This requires sophisticated statistical techniques, usually involving Bayesian models, to smooth the underlying risk estimates because the data are typically sparse. However, questions have been raised about the performance of these models for recovering the "true" risk surface, about the influence of the prior structure specified, and about the amount of smoothing of the risks that is actually performed. We describe a comprehensive simulation study designed to address these questions. Our results show that Bayesian disease-mapping models are essentially conservative, with high specificity even in situations with very sparse data but low sensitivity if the raised-risk areas have only a moderate (less than 2-fold) excess or are not based on substantial expected counts (> 50 per area). Semiparametric spatial mixture models typically produce less smoothing than their conditional autoregressive counterpart when there is sufficient information in the data (moderate-size expected count and/or high true excess risk). Sensitivity may be improved by exploiting the whole posterior distribution to try to detect true raised-risk areas rather than just reporting and mapping the mean posterior relative risk. For the widely used conditional autoregressive model, we show that a decision rule based on computing the probability that the relative risk is above 1 with a cutoff between 70 and 80% gives a specific rule with reasonable sensitivity for a range of scenarios having moderate expected counts (approximately 20) and excess risks (approximately 1.5- to 2-fold). Larger (3-fold) excess risks are detected almost certainly using this rule, even when based on small expected counts, although the mean of the posterior distribution is typically smoothed to about half the true value.
Figures


References
-
- Alexander FE, Boyle P. eds1996Methods for Investigating Localised Clustering of Disease IARC Sci Publ 1351–247. - PubMed
-
- Besag J, York J, Mollié A. Bayesian image restoration with applications in spatial statistics. Ann Inst Math Stat. 1991;43:1–20.
-
- Best NG, Arnol RA, Thomas A, Waller LA, Conlon EM. 1999. Bayesian models for spatially correlated disease and exposure data (with discussion). In: Bayesian Statistics 6 (Bernardo JM, Berger JO, Dawid AP, Smith AFM, eds). Oxford:Oxford University Press, 131–156.
-
- Carlin BP, Louis A. 2001. Bayes and Empirical Bayes Methods. 2nd ed. London:Chapman and Hall.
-
- Clayton D, Bernardinelli L. 1992. Bayesian methods for mapping disease risk. In: Geographical and Environment Epidemiology: Methods for Small Area Studies (Elliott P, Cuzick J, English D, Stern R, eds). Oxford:Oxford University Press, 205–220.
Publication types
MeSH terms
Substances
LinkOut - more resources
Full Text Sources

