. 2004 Jul;24(13):6067-75.
doi: 10.1128/MCB.24.13.6067-6075.2004.

Immune functions in mice lacking Clnk, an SLP-76-related adaptor expressed in a subset of immune cells

Affiliations

Immune functions in mice lacking Clnk, an SLP-76-related adaptor expressed in a subset of immune cells

Oliver Utting et al. Mol Cell Biol. 2004 Jul.

Abstract

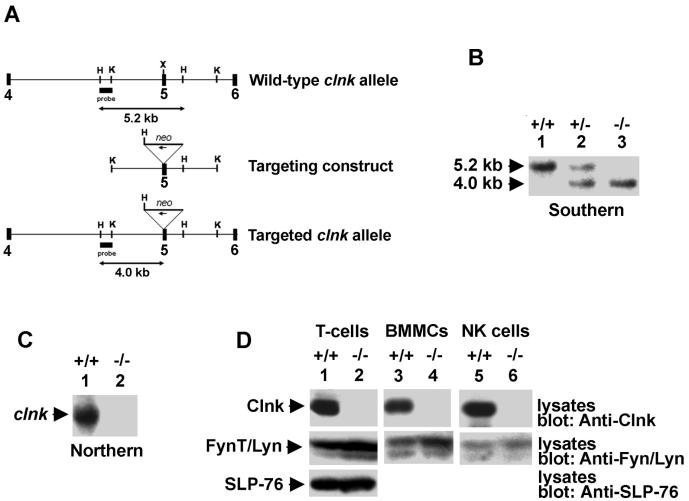
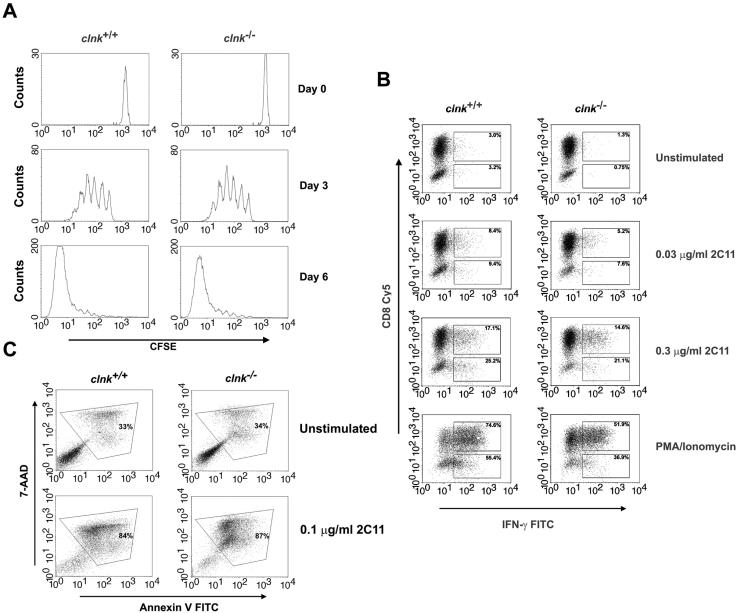
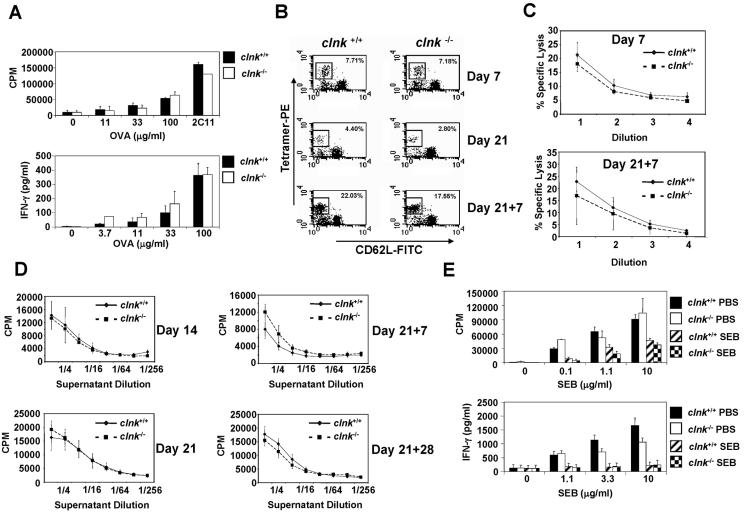
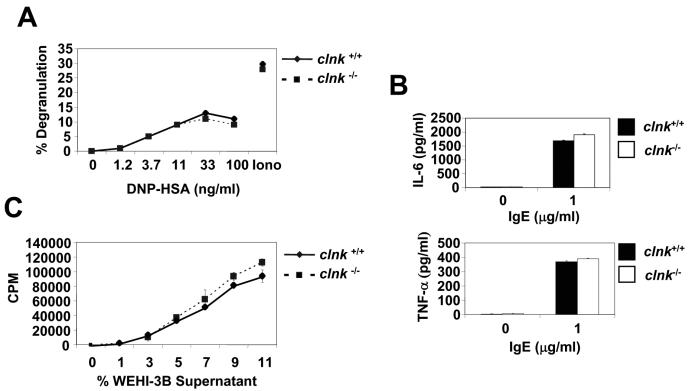
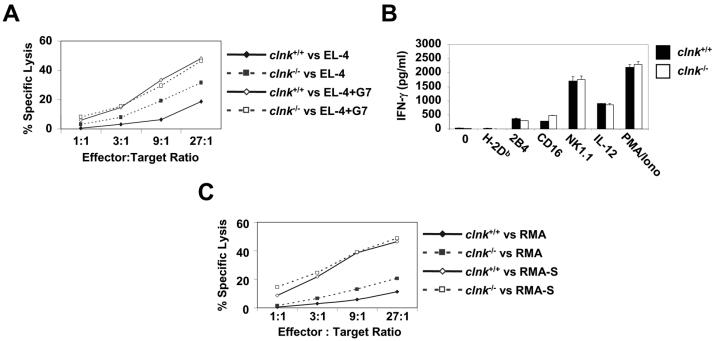
The SLP-76 family of immune cell-specific adaptors is composed of three distinct members named SLP-76, Blnk, and Clnk. They have been implicated in the signaling pathways coupled to immunoreceptors such as the antigen receptors and Fc receptors. Previous studies using gene-targeted mice and deficient cell lines showed that SLP-76 plays a central role in T-cell development and activation. Moreover, it is essential for normal mast cell and platelet activation. In contrast, Blnk is necessary for B-cell development and activation. While the precise function of Clnk is not known, it was reported that Clnk is selectively expressed in mast cells, natural killer (NK) cells, and previously activated T-cells. Moreover, ectopic expression of Clnk was shown to rescue T-cell receptor-mediated signal transduction in an SLP-76-deficient T-cell line, suggesting that, like its relatives, Clnk is involved in the positive regulation of immunoreceptor signaling. Stimulatory effects of Clnk on immunoreceptor signaling were also reported to occur in transfected B-cell and basophil leukemia cell lines. Herein, we attempted to address the physiological role of Clnk in immune cells by the generation of Clnk-deficient mice. The results of our studies demonstrated that Clnk is dispensable for normal differentiation and function of T cells, mast cells, and NK cells. Hence, unlike its relatives, Clnk is not essential for normal immune functions.


Figures

FIG. 1.
FIG. 1.
Molecular and biochemical characterization of Clnk-deficient mice. (A) clnk gene organization and targeting construct. A partial structure of the mouse clnk gene (exons 4 to 6) and a depiction of the targeting construct are shown. The position of the DNA fragment used as a probe for Southern blotting is shown. This probe hybridizes to a 5.2-kb HindIII fragment in clnk+/+ mice and to a 4.2-kb HindIII fragment in clnk−/− animals. (B) Southern blot depicting wild-type, heterozygous, and homozygous targeted alleles. Genomic DNA from mouse tails was digested with HindIII and tested by Southern blotting by using the probe depicted in panel A. (C) Northern blot. RNA was isolated from BMMCs derived from clnk+/+ and clnk−/− mice and probed by Northern blotting by using a full-length clnk cDNA as a probe. (D) Immunoblots. Lysates were prepared from anti-CD3 MAb-stimulated T cells (day 5 of IL-2 cultures), BMMCs, and NK cells. The presence of Clnk and that of SLP-76 were detected by immunoblotting by using polyclonal rabbit anti-Clnk (top panels) and anti-SLP-76 (bottom panel) sera, respectively. Equal loading was confirmed by reprobing the immunoblot membranes (middle panels) with anti-FynT (lanes 1 and 2) or anti-Lyn (lanes 3 to 6) antibodies.
FIG. 2.
FIG. 2.
In vitro assays of T-cell functions. (A) T-cell proliferation. T cells were labeled with CFSE and stimulated by use of plastic coated with anti-CD3 MAb 145-2C11 (1 μg per ml) in the presence of 100 U of IL-2 per ml. T-cell proliferation was assessed by measuring CFSE labeling at the indicated times after the initial stimulation. Proliferation of T cells causes a progressive loss in CFSE label. (B) TCR-induced production of IFN-γ. T cells were stimulated for 48 h with anti-CD3 MAb 145-2C11 and then expanded for 5 days in IL-2-supplemented growth medium. After being washed, cells were stimulated for 4 h and analyzed for IFN-γ production by intracellular staining with FITC-coupled anti-IFN-γ antibodies. CD8+ T cells were identified by concomitant staining with Cy5-labeled anti-CD8. CD8 T cells presumably represent CD4+ cells. Percentages indicate the proportions of cells (CD8+ or CD8) showing appreciable IFN-γ secretion. (C) Activation-induced T-cell death. T cells were stimulated for 48 h with anti-CD3 and expanded for 5 days with IL-2. Cells were then stimulated or not with plate-bound anti-CD3 MAb 145-2C11. This type of activation protocol is known to trigger AICD. After 18 h, AICD was assessed by staining cells with 7-AAD and FITC-labeled annexin V. Apoptotic cells (boxed) are positive for both 7-AAD and annexin V.
FIG. 3.
FIG. 3.
In vivo assays of T-cell functions. (A) T-cell memory. Mice were injected with ovalbumin (OVA) emulsified in CFA. Ten to fourteen weeks later, total spleen cells were stimulated with the indicated concentrations of OVA protein. Proliferation was assessed by measuring thymidine incorporation (top panel), whereas IFN-γ production was determined by ELISA (bottom panel). Control stimulation was performed by using soluble anti-CD3 MAb 145-2C11 (2C11) (3 μg per ml). Standard deviations are shown. (B) Antigen-specific anti-influenza virus T cells. Mice were infected with influenza virus as detailed in Materials and Methods. At the indicated times after primary (day 7 or day 21) or secondary (day 21 + 7) infection, MHC class I NP peptide tetramer-reactive CD8+ CD62Llo T cells (which represent antigen-specific effector T cells) were identified by flow cytometry. These results are representative of assays with three independent mice in each group. (C) Ex vivo cytotoxicity assay. Mice were infected as described in the legend for panel B. At the indicated times after primary (day 7) or secondary (day 21 + 7) infection, purified T cells were incubated in serial threefold dilutions (abscissa) with 51Cr-labeled EL-4 cells prepulsed with NP peptide. 51Cr release was measured and is presented as the percentage of maximal release. Standard deviations are shown. These results are representative of assays with three independent mice in each group. (D) CD4+ T-cell-mediated production of IL-2. Mice were infected as described for panel B. At the indicated times after primary (day 14 and day 21) or secondary (day 21 + 7 and day 21 + 28) infection, spleen cells were isolated and incubated for 48 h with heat-killed influenza virus. IL-2 production was then measured by monitoring CTLL-2 proliferation in the presence of serial dilutions (abscissa) of supernatant. Standard deviations are depicted. These results are representative of assays with three independent mice in each group. (E) T-cell anergy. Mice were injected intraperitoneally with SEB or PBS. After 14 days, CD4+ cells were purified and stimulated with the indicated concentrations of SEB in the presence of irradiated splenocytes. Proliferation (top panel) and IFN-γ production (bottom panel) were measured as detailed in the legend to Fig. 3A. In the experiment shown, 10 and 16% of purified CD4+ T cells were positive for Vβ8.1/2 in clnk+/+ and clnk−/− mice, respectively (data not shown). Standard deviations are shown.
FIG. 4.
FIG. 4.
Analyses of mast cell functions. (A) Antigen-induced degranulation. BMMCs were sensitized with anti-DNP IgE and triggered by addition of the indicated concentrations of the antigen DNP-HSA. Degranulation was assessed by measuring the release of β-hexosaminidase in the supernatant. Control degranulation was examined in the presence of ionomycin (Iono). Values are presented as percentages of maximal release. Degranulation was measured in response to DNP-HSA. (B) IgE-induced cytokine secretion. Cells were stimulated for 3 h with the indicated concentration of IgE, and secretions of IL-6 (top panel) and TNF-α (bottom panel) were determined by ELISA. Similar results were obtained over a range of different IgE concentrations (data not shown). Standard deviations are represented. (C) IL-3-induced proliferation. BMMCs were incubated in the absence of IL-3-containing medium for 8 h. Then, they were cultured for 18 h in the presence of the indicated concentrations (represented as a percentage of final volume) of WEHI-3B supernatant (a source of IL-3). Proliferation was determined by measuring thymidine incorporation. Standard deviations are represented.
FIG. 5.
FIG. 5.
Analyses of NK cell functions. (A) Antibody-mediated cellular cytotoxicity. NK cells were incubated at the indicated ratios of effector cells to target cells with 51Cr-labeled EL-4 target cells, in the presence or absence of anti-Thy MAb G7 (which binds Thy1 on EL-4 and triggers CD16 on NK cells). Target cell lysis was determined by measuring 51Cr release in the supernatant (values are percentages of maximal release). Standard deviations are shown. (B) IFN-γ secretion. Cells were stimulated with the indicated antibodies (1 μg per ml), IL-12 (5 ng per ml), or PMA (50 ng per ml) plus ionomycin (1 μg per ml). After 24 h, the production of IFN-γ was measured in the supernatant by ELISA. Standard deviations are shown. Similar results were obtained over a range of different antibody concentrations (data not shown). Standard deviations are represented. (C) Natural cytotoxicity. NK cells were stimulated at the indicated ratios of effector cells to target cells with 51Cr-labeled RMA (MHC class I-positive) or RMA-S (MHC class I-negative) cells. After 4 h, natural killing was assessed by measuring the release of 51Cr in the medium. Values are presented as percentages of maximal release. Standard deviations are shown.

Similar articles

Cited by

References

    1. Abtahian, F., A. Guerriero, E. Sebzda, M. M. Lu, R. Zhou, A. Mocsai, E. E. Myers, B. Huang, D. G. Jackson, V. A. Ferrari, V. Tybulewicz, C. A. Lowell, J. J. Lepore, G. A. Koretzky, and M. L. Kahn. 2003. Regulation of blood and lymphatic vascular separation by signaling proteins SLP-76 and Syk. Science 299:247-251. - PMC - PubMed
    1. Bertram, E. M., P. Lau, and T. H. Watts. 2002. Temporal segregation of 4-1BB versus CD28-mediated costimulation: 4-1BB ligand influences T cell numbers late in the primary response and regulates the size of the T cell memory response following influenza infection. J. Immunol. 168:3777-3785. - PubMed
    1. Biassoni, R., C. Cantoni, D. Pende, S. Sivori, S. Parolini, M. Vitale, C. Bottino, and A. Moretta. 2001. Human natural killer cell receptors and co-receptors. Immunol. Rev. 181:203-214. - PubMed
    1. Bonilla, F. A., R. M. Fujita, V. I. Pivniouk, A. C. Chan, and R. S. Geha. 2000. Adapter proteins SLP-76 and BLNK both are expressed by murine macrophages and are linked to signaling via Fcgamma receptors I and II/III. Proc. Natl. Acad. Sci. USA 97:1725-1730. - PMC - PubMed
    1. Brandle, D., K. Burki, V. A. Wallace, U. H. Rohrer, T. W. Mak, B. Malissen, H. Hengartner, and H. Pircher. 1991. Involvement of both T cell receptor V alpha and V beta variable region domains and alpha chain junctional region in viral antigen recognition. Eur. J. Immunol. 21:2195-2202. - PubMed

Publication types

Substances