. 2004 Jun;113(12):1763-73.
doi: 10.1172/JCI20369.

Novel targeted deregulation of c-Myc cooperates with Bcl-X(L) to cause plasma cell neoplasms in mice

Affiliations

Novel targeted deregulation of c-Myc cooperates with Bcl-X(L) to cause plasma cell neoplasms in mice

Wan Cheung Cheung et al. J Clin Invest. 2004 Jun.

Abstract

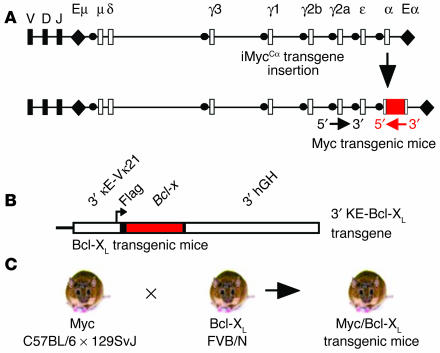
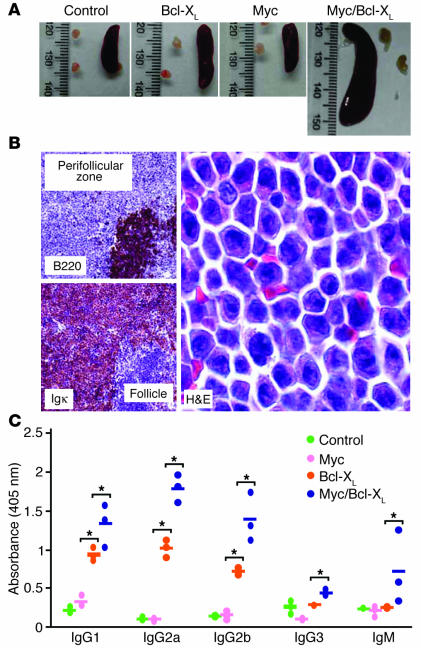
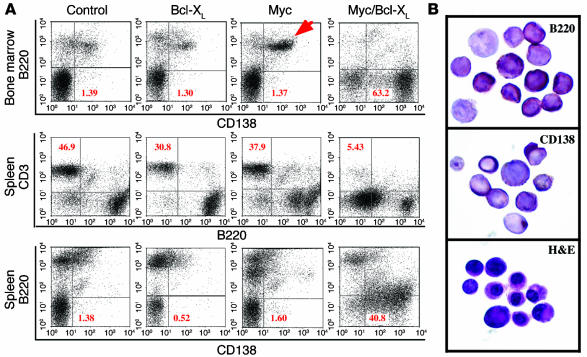
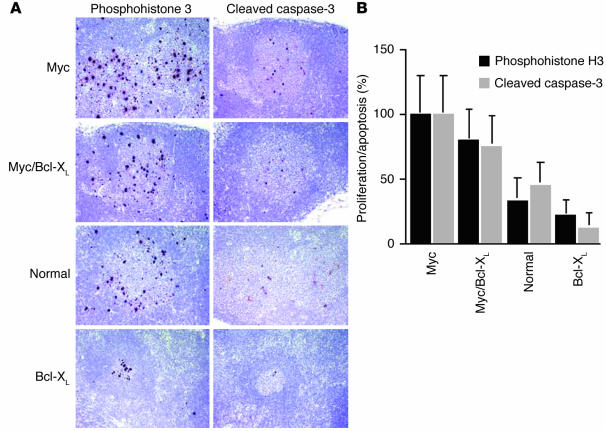
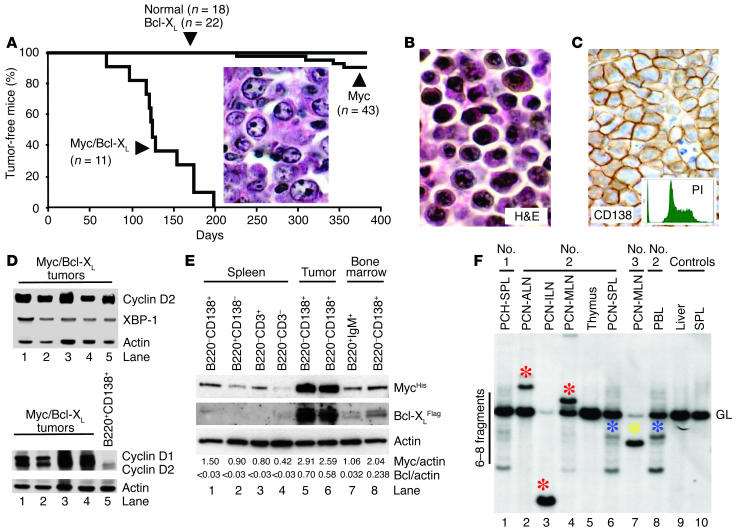
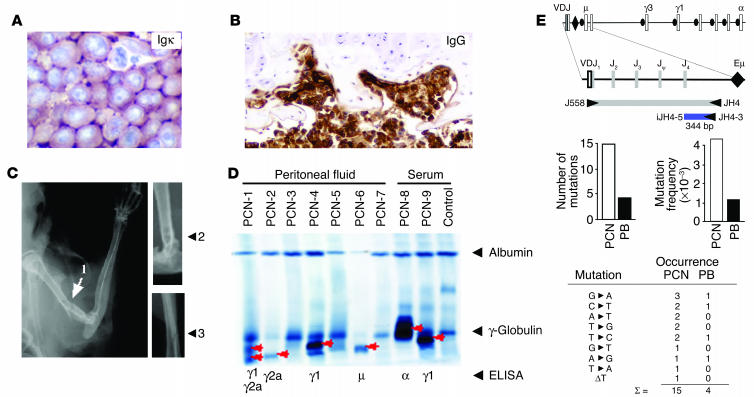
Deregulated expression of both Myc and Bcl-X(L) are consistent features of human plasma cell neoplasms (PCNs). To investigate whether targeted expression of Myc and Bcl-X(L) in mouse plasma cells might lead to an improved model of human PCN, we generated Myc transgenics by inserting a single-copy histidine-tagged mouse Myc gene, Myc(His), into the mouse Ig heavy-chain Calpha locus. We also generated Bcl-X(L) transgenic mice that contain a multicopy Flag-tagged mouse Bcl-x(Flag) transgene driven by the mouse Ig kappa light-chain 3' enhancer. Single-transgenic Bcl-X(L) mice remained tumor free by 380 days of age, whereas single-transgenic Myc mice developed B cell tumors infrequently (4 of 43, 9.3%). In contrast, double-transgenic Myc/Bcl-X(L) mice developed plasma cell tumors with short onset (135 days on average) and full penetrance (100% tumor incidence). These tumors produced monoclonal Ig, infiltrated the bone marrow, and contained elevated amounts of Myc(His) and Bcl-X(L)(Flag) proteins compared with the plasma cells that accumulated in large numbers in young tumor-free Myc/Bcl-X(L) mice. Our findings demonstrate that the enforced expression of Myc and Bcl-X(L) by Ig enhancers with peak activity in plasma cells generates a mouse model of human PCN that recapitulates some features of human multiple myeloma.


Figures

Figure 1
Figure 1
Experimental overview of the generation of double-transgenic Myc/Bcl-XL mice. (A) Generation of Myc transgenic mice. Shown are the normal mouse Igh locus (top) and the targeted Igh locus with the inserted MycHis gene (bottom). The transcriptional orientation of Igh and MycHis is indicated by a black and a red arrow, respectively. (B) Generation of Bcl-XL transgenic mice. Depicted is a scheme of the Bcl-x transgene, which consists of the mouse 3′ κ enhancer; the promoter of the mouse variable κ gene, Vκ21; the mouse Bcl-x cDNA fused to the Flag epitope_encoding sequence; and the 3′ untranslated region of the human growth hormone (3′ hGH), a facilitator of Bcl-x expression. (C) Myc/Bcl-XL bitransgenics were on a mixed genetic background containing alleles from strains C57BL/6, 129SvJ, and FVB/N.
Figure 2
Figure 2
Plasmacytosis and hypergammaglobulinemia in tumor-free Myc/Bcl-XL transgenic mice. (A) Splenomegaly in double-transgenic Myc/Bcl-XL mice relative to age-matched single-transgenic Myc and Bcl-XL mice and nontransgenic littermate controls. (B) Massive accumulation of plasmablasts and plasma cells in extrafollicular areas of the spleen in Myc/Bcl-XL transgenics. Left: Low-power view of follicular B cells (top) and plasma cells immunostained for B220 and κ light-chain expression, respectively (original magnification, ∞4). Right: High-power view of plasmablasts and plasma cells stained with H&E (original magnification, ∞63). (C) Marked elevation of serum Ig’s in Myc/Bcl-XL transgenic mice, measured by ELISA. *Significant difference (P < 0.05) by Student’s t test.
Figure 3
Figure 3
Plasmacytosis in Myc/Bcl-XL transgenic mice. (A) The percentage of B220CD138+ plasma cells in the bone marrow (top row) and the spleen (bottom row) is indicated in the lower right quadrants of the depicted FACS scatter plots. The percentage of B220CD3+ T cells in the spleen (center row) is indicated in the upper left quadrants. The red arrow denotes a population of B220+CD138+ plasmablasts in the bone marrow of Myc transgenic mice. (B) FACS-sorted B220+CD138+ cells from the bone marrow of Myc transgenic mice express B220 (top), CD138 (center), and Igκ (not shown) by immunostaining and exhibit cytological features of plasmablasts and plasma cells by H&E staining (bottom; original magnification, ∞63).
Figure 4
Figure 4
Proliferation and apoptosis in lymph node follicles of 8-week-old Myc, Myc/Bcl-XL, and Bcl-XL mice compared with normal nontransgenic littermates. (A) Sections of a peripheral lymph node containing two follicles. Follicular B cells undergoing proliferation or apoptosis are immunostained (brown spots) for phosphohistone H3 or activated caspase-3, respectively (original magnification, ∞40). The images are ordered from top to bottom according to the apparent turnover of follicular B cells, which was highest in the Myc mice and lowest in the Bcl-XL mice. (B) The result of the microscopic enumeration of proliferating B cells (black bars) and dying B cells (gray bars) in lymph node follicles. Three lymph nodes of each mouse strain were evaluated to determine mean values and SDs of the mean.
Figure 5
Figure 5
Plasma cell neoplasms in Myc/Bcl-XL transgenic mice. (A) Bcl-XL transgenic mice (n = 22), nontransgenic littermates (n = 10, not shown), and C57BL/6 mice (n = 18) remained tumor free. Three of four tumors that developed in Myc transgenic mice (n = 43) were diffuse large B cell lymphomas containing abundant neoplastic centroblasts (inset, H&E; original magnification, _63). (B) Typical Myc/Bcl-XL plasma cell tumor stained with H&E (original magnification, _63). (C) Myc/Bcl-XL plasma cell neoplasm immunostained for CD138 (brown; original magnification, _40). The inset shows a FACS profile of the vigorously proliferating propidium iodine_stained tumor cells. (D) Western analysis of five Myc/Bcl-XL plasma cell tumors for expression of cyclin D2 (Myc target), XBP-1 (plasma cell transcription factor), and actin (loading control, top panel). Cyclin D1/D2 expression in Myc/Bcl-XL plasma cell tumors (lanes 1_4) compared with “premalignant” plasmablasts from tumor-free Myc/Bcl-XL mice (lane 5, bottom panel). (E) Western analysis of MycHis and Bcl-XLFlag expression in flow-sorted Myc/Bcl-XL tumor cells (lanes 5_6) compared with cells from spleen (lanes 1_4) and bone marrow (lanes 7_8) of tumor-free Myc/Bcl-XL mice. Bcl-XL occurs in two alternative splice forms, with and without transmembrane domain. Myc and Bcl-XL were detected with antibodies against the histidine and Flag epitopes. (F) Southern analysis for clonotypic Igκ rearrangements in PCNs (lanes 2_4, 6, and 7), spleen (SPL) with plasma cell hyperplasia (PCH; lane 1), thymus (lane 5), and peripheral blood leukocytes (PBL; lane 8) from three Myc/Bcl-XL mice compared with liver and spleen from nontransgenic littermates. ALN, axillary LN; ILN, inguinal LN; MLN, mesenteric LN; GL, germline.
Figure 6
Figure 6
Myc/Bcl-XL PCNs infiltrate the bone marrow, produce monoclonal Ig, and cause osteolytic lesions. (A) Bone marrow infiltration with Igκ-producing neoplastic plasma cells (original magnification, _63). (B) Palisades of neoplastic plasma cells (brown) destroying the luminal face of a femur’s corticalis (IgG immunostaining; original magnification, _40). Two bone resorption lacunae are denoted by arrows. (C) Radiographs of large osteolytic lesion with apparent pathological fracture (1, left humerus), osteolytic lesion without fracture (2, right femur), and hairline fracture without visible osteolytic lesion (3, left forearm). (D) Protein electropherogram of serum and peritoneal lavage samples containing M-spikes (red arrows) isotyped using ELISA (bottom). (E) Frequency and type of mutations in the 3′ JH4 region of rearranged variable (V) genes. Shown at the top is a scheme of the mouse Igh locus. PCR primers J558 and JH4 were used to amplify rearranged VDJ genes and linked 3′JH4 sequences. Sequencing primers iJH4-5′ and iJH4-3′ were used to detect mutations in the 344-bp 3′ JH4 region. Shown in the center are bar diagrams of the number of mutations in the 3′ JH4 region in PCNs and plasmablasts from tumor-free Myc/Bcl-XL mice (PB, left panel). The corresponding mutation frequencies (mutations/3440 bp) are plotted to the right. Shown at the bottom are types and occurrences of base substitution mutations in the 3′ JH4 region of rearranged VH genes in PCN and PB. The tumor sample also contained a deletion, δT. The location of the mutation in the 3′ JH4 regions is depicted in Supplemental Figure 6.

Similar articles

Cited by

References

    1. Radl J. Multiple myeloma and related disorders. Lessons from an animal model. Pathol. Biol. (Paris). 1999;47:109–114. - PubMed
    1. Potter M. Experimental plasmacytomagenesis in mice. Hematol. Oncol. Clin. North Am. 1997;11:323–347. - PubMed
    1. Yaccoby S, Barlogie B, Epstein J. Primary myeloma cells growing in SCID-hu mice: a model for studying the biology and treatment of myeloma and its manifestations. Blood. 1998;92:2908–2913. - PubMed
    1. Yaccoby S, Epstein J. The proliferative potential of myeloma plasma cells manifest in the SCID-hu host. Blood. 1999;94:3576–3582. - PubMed
    1. Pearse RN, et al. Multiple myeloma disrupts the TRANCE/ osteoprotegerin cytokine axis to trigger bone destruction and promote tumor progression. Proc. Natl. Acad. Sci. U. S. A. 2001;98:11581–11586. - PMC - PubMed

Publication types

MeSH terms