

Laboratory diagnosis of SARS
- PMID: 15200815
- PMCID: PMC3323215
- DOI: 10.3201/eid1005.030682
Laboratory diagnosis of SARS
Abstract
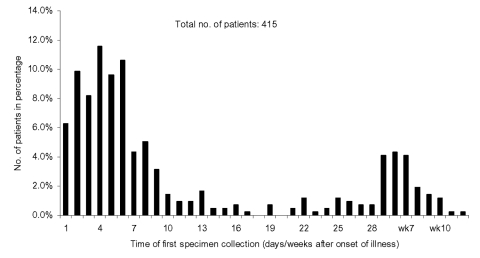
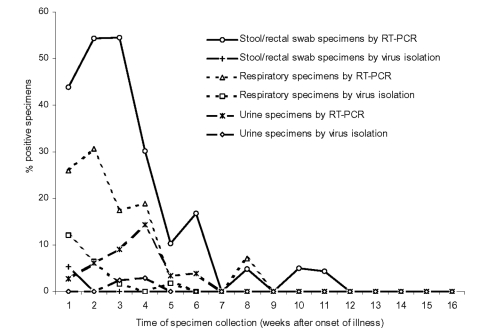
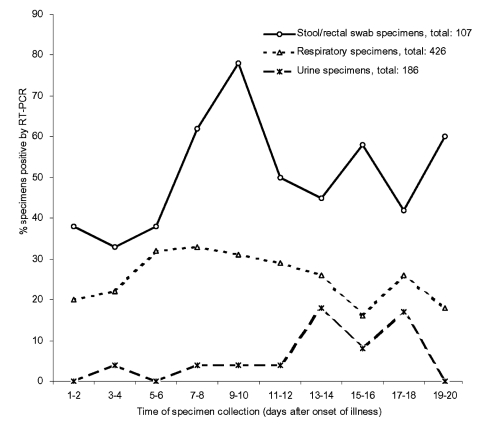
The virologic test results of 415 patients with severe acute respiratory syndrome (SARS) were examined. The peak detection rate for SARS-associated coronavirus occurred at week 2 after illness onset for respiratory specimens, at weeks 2 to 3 for stool or rectal swab specimens, and at week 4 for urine specimens. The latest stool sample that was positive by reverse transcription-polymerase chain reaction (RT-PCR) was collected on day 75 while the patient was receiving intensive care. Tracheal aspirate and stool samples had a higher diagnostic yield (RT-PCR average positive rate for first 2 weeks: 66.7% and 56.5%, respectively). Pooled throat and nasal swabs, rectal swab, nasal swab, throat swab, and nasopharyngeal aspirate specimens provided a moderate yield (29.7%-40.0%), whereas throat washing and urine specimens showed a lower yield (17.3% and 4.5%). The collection procedures for stool and pooled nasal and throat swab specimens were the least likely to transmit infection, and the combination gave the highest yield for coronavirus detection by RT-PCR. Positive virologic test results in patient groups were associated with mechanical ventilation or death (p < 0.001), suggesting a correlation between viral load and disease severity.
Figures
References
MeSH terms
Substances
LinkOut - more resources
Full Text Sources
Medical
Miscellaneous