

Predicting geographic variation in cutaneous leishmaniasis, Colombia
- PMID: 15200848
- PMCID: PMC3323104
- DOI: 10.3201/eid1004.030241
Predicting geographic variation in cutaneous leishmaniasis, Colombia
Abstract
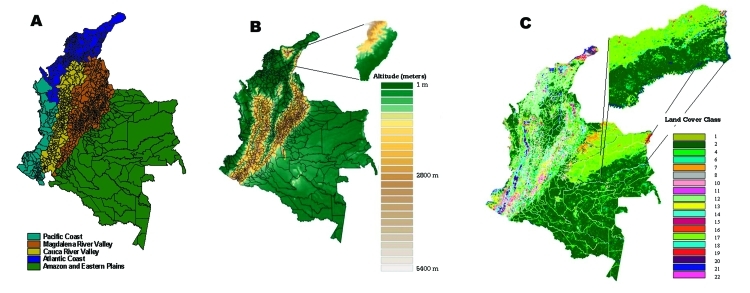
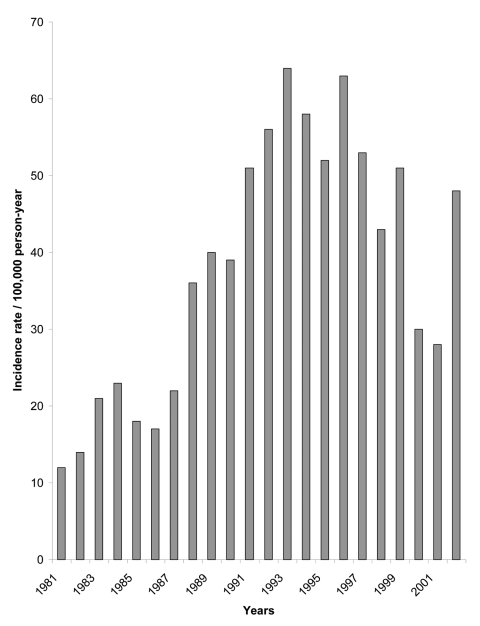
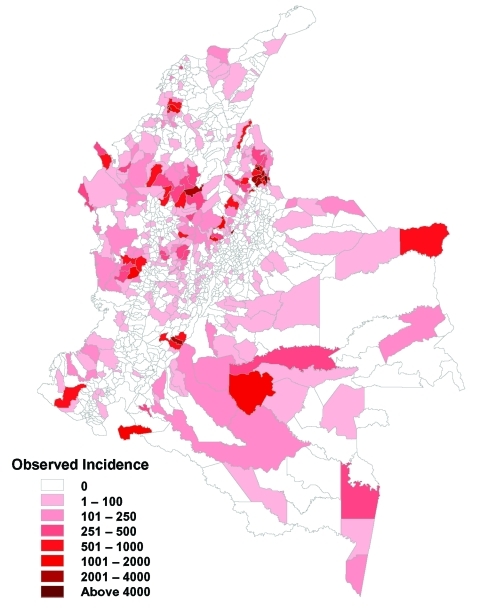
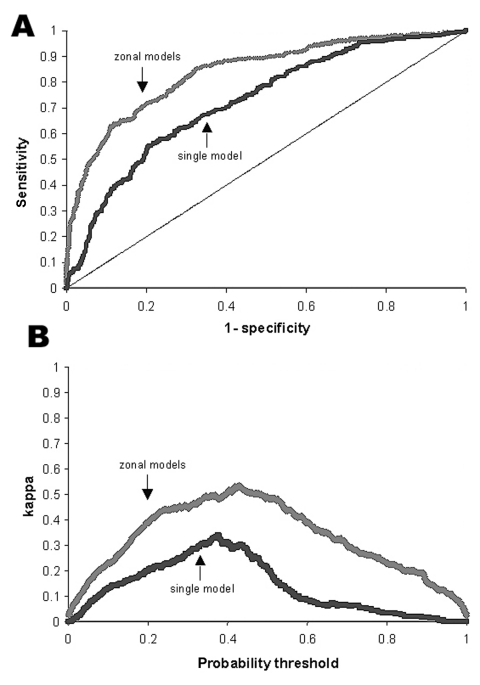
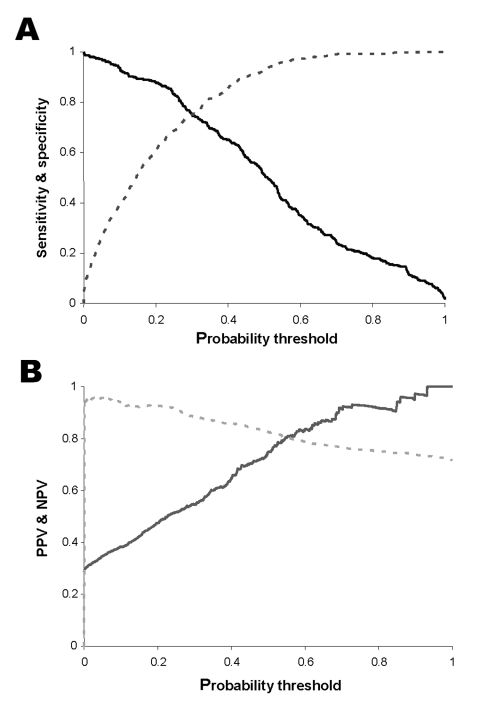
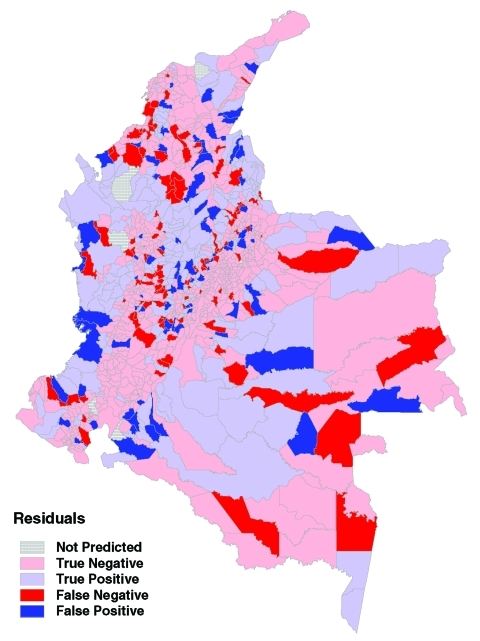
Approximately 6,000 cases of cutaneous leishmaniasis are reported annually in Colombia, a greater than twofold increase since the 1980s. Such reports certainly underestimate true incidence, and their geographic distribution is likely biased by local health service effectiveness. We investigated how well freely available environmental data explain the distribution of cases among 1,079 municipalities. For each municipality, a unique predictive logistic regression model was derived from the association among remaining municipalities between elevation, land cover (preclassified maps derived from satellite images), or both, and the odds of at least one case being reported. Land cover had greater predictive power than elevation; using both datasets improved accuracy. Fitting separate models to different ecologic zones, reflecting transmission cycle diversity, enhanced the accuracy of predictions. We derived measures that can be directly related to disease control decisions and show how results can vary, depending on the threshold selected for predicting a disease-positive municipality. The results identify areas where disease is most likely to be underreported.
Figures

Similar articles
-
Environmental and socio-economic determinants associated with the occurrence of cutaneous leishmaniasis in the northeast of Colombia.Trans R Soc Trop Med Hyg. 2017 Dec 1;111(12):564-571. doi: 10.1093/trstmh/try011. Trans R Soc Trop Med Hyg. 2017. PMID: 29509941
-
Temporal lagged relationship between a vegetation index and cutaneous leishmaniasis cases in Colombia: an analysis implementing a distributed lag nonlinear model.Parasitol Res. 2020 Mar;119(3):1075-1082. doi: 10.1007/s00436-019-06592-4. Epub 2020 Jan 3. Parasitol Res. 2020. PMID: 31901109
-
Spatial Distribution of Sand Fly Vectors and Eco-Epidemiology of Cutaneous Leishmaniasis Transmission in Colombia.PLoS One. 2015 Oct 2;10(10):e0139391. doi: 10.1371/journal.pone.0139391. eCollection 2015. PLoS One. 2015. PMID: 26431546 Free PMC article.
-
An investigation of the effects of environmental and ecologic factors on cutaneous leishmaniasis in the old world: a systematic review study.Rev Environ Health. 2020 Sep 7;36(1):117-128. doi: 10.1515/reveh-2020-0066. Print 2021 Mar 26. Rev Environ Health. 2020. PMID: 32892182
-
Effect of El Niño Southern Oscillation cycle on the potential distribution of cutaneous leishmaniasis vector species in Colombia.PLoS Negl Trop Dis. 2020 May 28;14(5):e0008324. doi: 10.1371/journal.pntd.0008324. eCollection 2020 May. PLoS Negl Trop Dis. 2020. PMID: 32463829 Free PMC article.
Cited by
-
Information to act: household characteristics are predictors of domestic infestation with the Chagas vector Triatoma dimidiata in Central America.Am J Trop Med Hyg. 2015 Jul;93(1):97-107. doi: 10.4269/ajtmh.14-0596. Epub 2015 Apr 13. Am J Trop Med Hyg. 2015. PMID: 25870430 Free PMC article.
-
Data-driven predictions of potential Leishmania vectors in the Americas.PLoS Negl Trop Dis. 2023 Feb 21;17(2):e0010749. doi: 10.1371/journal.pntd.0010749. eCollection 2023 Feb. PLoS Negl Trop Dis. 2023. PMID: 36809249 Free PMC article.
-
A Disease Control-Oriented Land Cover Land Use Map for Myanmar.Data (Basel). 2021 Jun;6(6):63. doi: 10.3390/data6060063. Epub 2021 Jun 13. Data (Basel). 2021. PMID: 34504894 Free PMC article.
-
Modelling spatiotemporal patterns of visceral leishmaniasis incidence in two endemic states in India using environment, bioclimatic and demographic data, 2013-2022.PLoS Negl Trop Dis. 2024 Feb 5;18(2):e0011946. doi: 10.1371/journal.pntd.0011946. eCollection 2024 Feb. PLoS Negl Trop Dis. 2024. PMID: 38315725 Free PMC article.
-
Environmental risk factors for the incidence of American cutaneous leishmaniasis in a sub-Andean zone of Colombia (Chaparral, Tolima).Am J Trop Med Hyg. 2010 Feb;82(2):243-50. doi: 10.4269/ajtmh.2010.09-0218. Am J Trop Med Hyg. 2010. PMID: 20134000 Free PMC article.
References
-
- World Health Organization. Leishmaniasis and Leishmania/HIV co-infection. WHO report on global surveillance of epidemic-prone infectious diseases 2000. [cited 2003 Sept]. Available from: http://www.who.int/emc-documents/surveillance/docs/whocdscsrisr2001.html...
-
- Lainson R. Demographic changes and their influence on the epidemiology of the American leishmaniases. In: Service MW, editor. Demography and vector-borne diseases. Boca Raton (FL): CRC Press; 1989. p. 85–106.
-
- Ready PD, Lainson R, Shaw JJ. Leishmaniasis in Brazil: XX. Prevalence of “enzootic rodent leishmaniasis” (Leishmania mexicana amazonensis), and apparent absence of “pian bois” (Le. braziliensis guyanensis), in plantations of introduced tree species and in other nonclimax forests in eastern Amazonia. Trans R Soc Trop Med Hyg. 1983;77:775–85. 10.1016/0035-9203(83)90288-2 - DOI - PubMed
MeSH terms
LinkOut - more resources
Full Text Sources