

Epidemiologic determinants for modeling pneumonic plague outbreaks
- PMID: 15200849
- PMCID: PMC3323083
- DOI: 10.3201/eid1004.030509
Epidemiologic determinants for modeling pneumonic plague outbreaks
Abstract
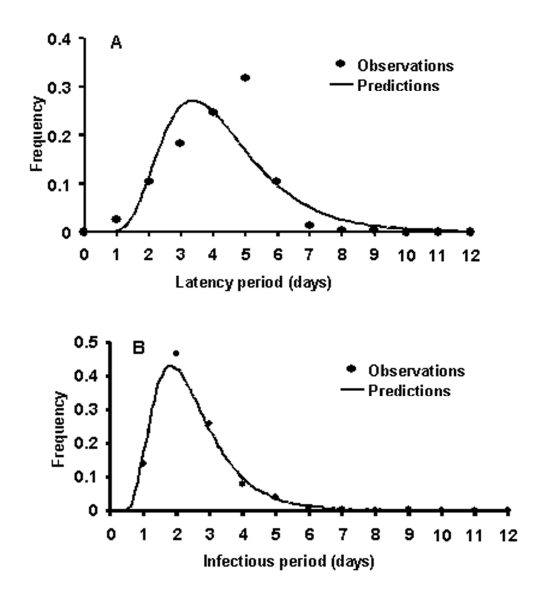
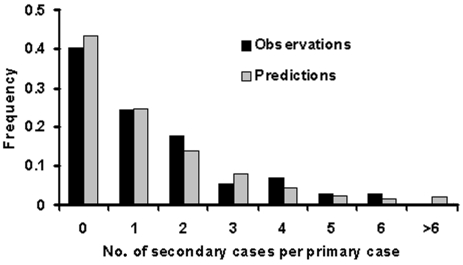
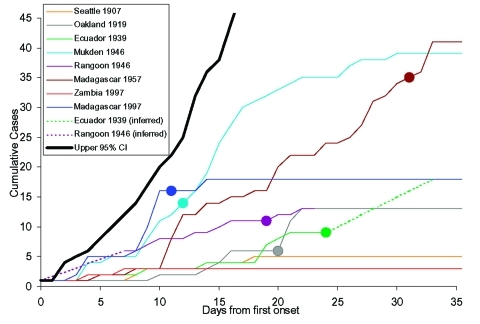
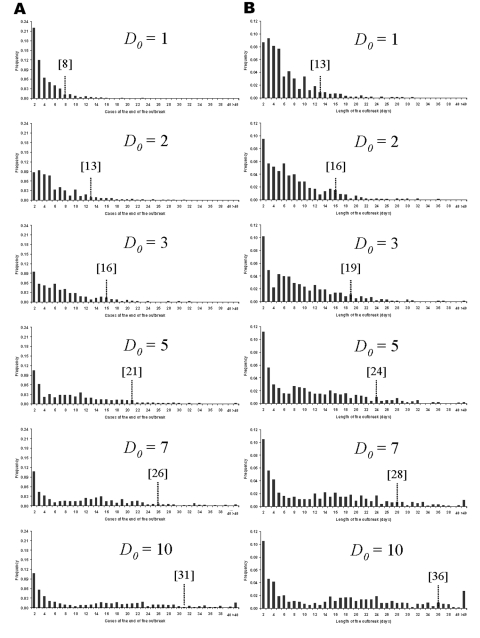
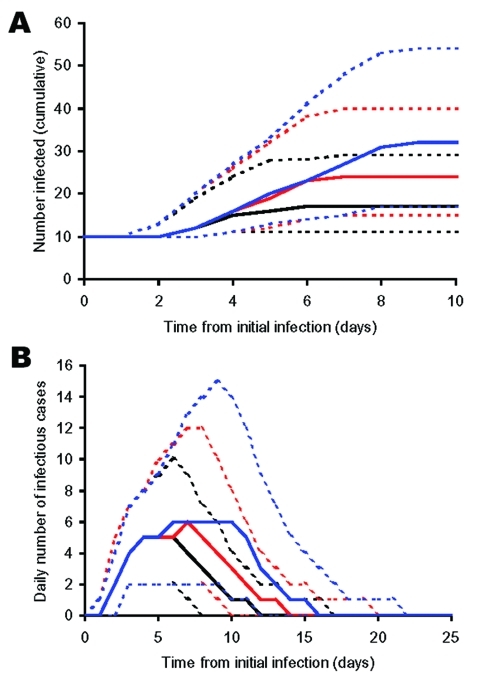
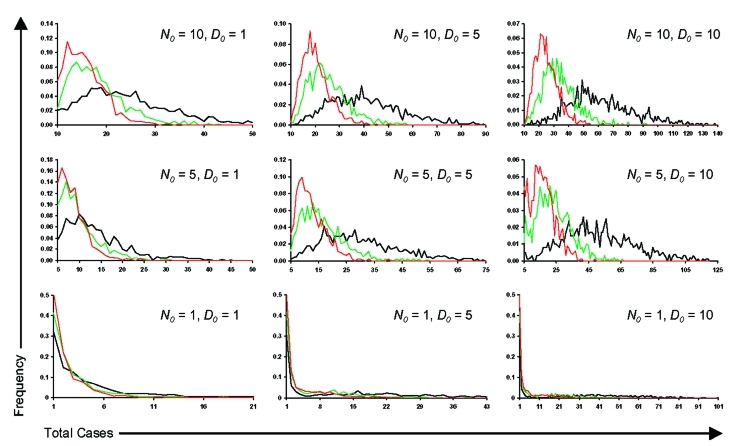
Pneumonic plague poses a potentially increasing risk to humans in plague nonendemic regions either as a consequence of an aerosolized release or through importation of the disease. Pneumonic plague is person-to-person transmissible. We provide a quantitative assessment of transmissibility based on past outbreaks that shows that the average number of secondary cases per primary case (R0) was 1.3 (variance = 3.1), assuming a geometric probability distribution, prior to outbreak control measures. We also show that the latent and infectious periods can be approximated by using lognormal distributions with means (SD) of 4.3 (1.8) and 2.5 (1.2) days. Based on this parameter estimation, we construct a Markov-chain epidemic model to demonstrate the potential impact of delays in implementing outbreak control measures and increasing numbers of index cases on the incidence of cases in simulated outbreaks.
Figures
Similar articles
-
A plague on five of your houses--statistical re-assessment of three pneumonic plague outbreaks that occurred in Suffolk, England, between 1906 and 1918.Theor Biol Med Model. 2010 Oct 25;7:39. doi: 10.1186/1742-4682-7-39. Theor Biol Med Model. 2010. PMID: 20973955 Free PMC article.
-
Estimating the transmission potential of supercritical processes based on the final size distribution of minor outbreaks.J Theor Biol. 2012 Feb 7;294:48-55. doi: 10.1016/j.jtbi.2011.10.039. Epub 2011 Nov 7. J Theor Biol. 2012. PMID: 22079419 Free PMC article.
-
Dynamics of the pneumonic plague epidemic in Madagascar, August to October 2017.Euro Surveill. 2017 Nov;22(46):17-00710. doi: 10.2807/1560-7917.ES.2017.22.46.17-00710. Euro Surveill. 2017. PMID: 29162211 Free PMC article.
-
The rise of pneumonic plague in Madagascar: current plague outbreak breaks usual seasonal mould.J Med Microbiol. 2019 Mar;68(3):292-302. doi: 10.1099/jmm.0.000915. Epub 2019 Jan 11. J Med Microbiol. 2019. PMID: 30632956 Review.
-
Risk of person-to-person transmission of pneumonic plague.Clin Infect Dis. 2005 Apr 15;40(8):1166-72. doi: 10.1086/428617. Epub 2005 Mar 16. Clin Infect Dis. 2005. PMID: 15791518 Review.
Cited by
-
Transmission potential of primary pneumonic plague: time inhomogeneous evaluation based on historical documents of the transmission network.J Epidemiol Community Health. 2006 Jul;60(7):640-5. doi: 10.1136/jech.2005.042424. J Epidemiol Community Health. 2006. PMID: 16790838 Free PMC article.
-
Human ectoparasite transmission of the plague during the Second Pandemic is only weakly supported by proposed mathematical models.Proc Natl Acad Sci U S A. 2018 Aug 21;115(34):E7892-E7893. doi: 10.1073/pnas.1809775115. Epub 2018 Aug 3. Proc Natl Acad Sci U S A. 2018. PMID: 30076235 Free PMC article. No abstract available.
-
Pneumonic plague outbreak, Northern Madagascar, 2011.Emerg Infect Dis. 2015 Jan;21(1):8-15. doi: 10.3201/eid2101.131828. Emerg Infect Dis. 2015. PMID: 25530466 Free PMC article.
-
A plague on five of your houses--statistical re-assessment of three pneumonic plague outbreaks that occurred in Suffolk, England, between 1906 and 1918.Theor Biol Med Model. 2010 Oct 25;7:39. doi: 10.1186/1742-4682-7-39. Theor Biol Med Model. 2010. PMID: 20973955 Free PMC article.
-
Comparative SIR/SEIR modeling of the Antonine Plague in Rome.PLoS One. 2025 Feb 13;20(2):e0313684. doi: 10.1371/journal.pone.0313684. eCollection 2025. PLoS One. 2025. PMID: 39946392 Free PMC article.
References
-
- Poland JD, Barnes AM. Plague. In: Steele JH, editors. CRC handbook series in Zoonoses Section, A: bacterial, rickettsial and mycotic diseases, Volume 1. Boca Raton, FL: CRC Press Inc.; 1976. p. 515–96.
-
- Dennis DT, Gage KL, Gratz ND, Poland JD, Tikhomirov E. Plague manual: epidemiology, distribution, surveillance and control. World Health Organization; Geneva:1999.
-
- World Health Organization Group of Consultants. Health aspects of chemical and biological weapons. Geneva: World Health Organization; 1970.
-
- Titball RW, Eley S, Wiliamson ED, Dennis DT. Plague. In: Plotkin SA, Orenstien WA editors. Vaccines. Philadelphia: W.B. Saunders Company; 1999:734–42.
Publication types
MeSH terms
LinkOut - more resources
Full Text Sources
Medical
Miscellaneous