. 2004 Jun 16;24(24):5592-602.
doi: 10.1523/JNEUROSCI.1038-04.2004.

Paradoxical potentiation of neuronal T-type Ca2+ current by ATP at resting membrane potential

Affiliations

Paradoxical potentiation of neuronal T-type Ca2+ current by ATP at resting membrane potential

Nathalie Leresche et al. J Neurosci. .

Abstract

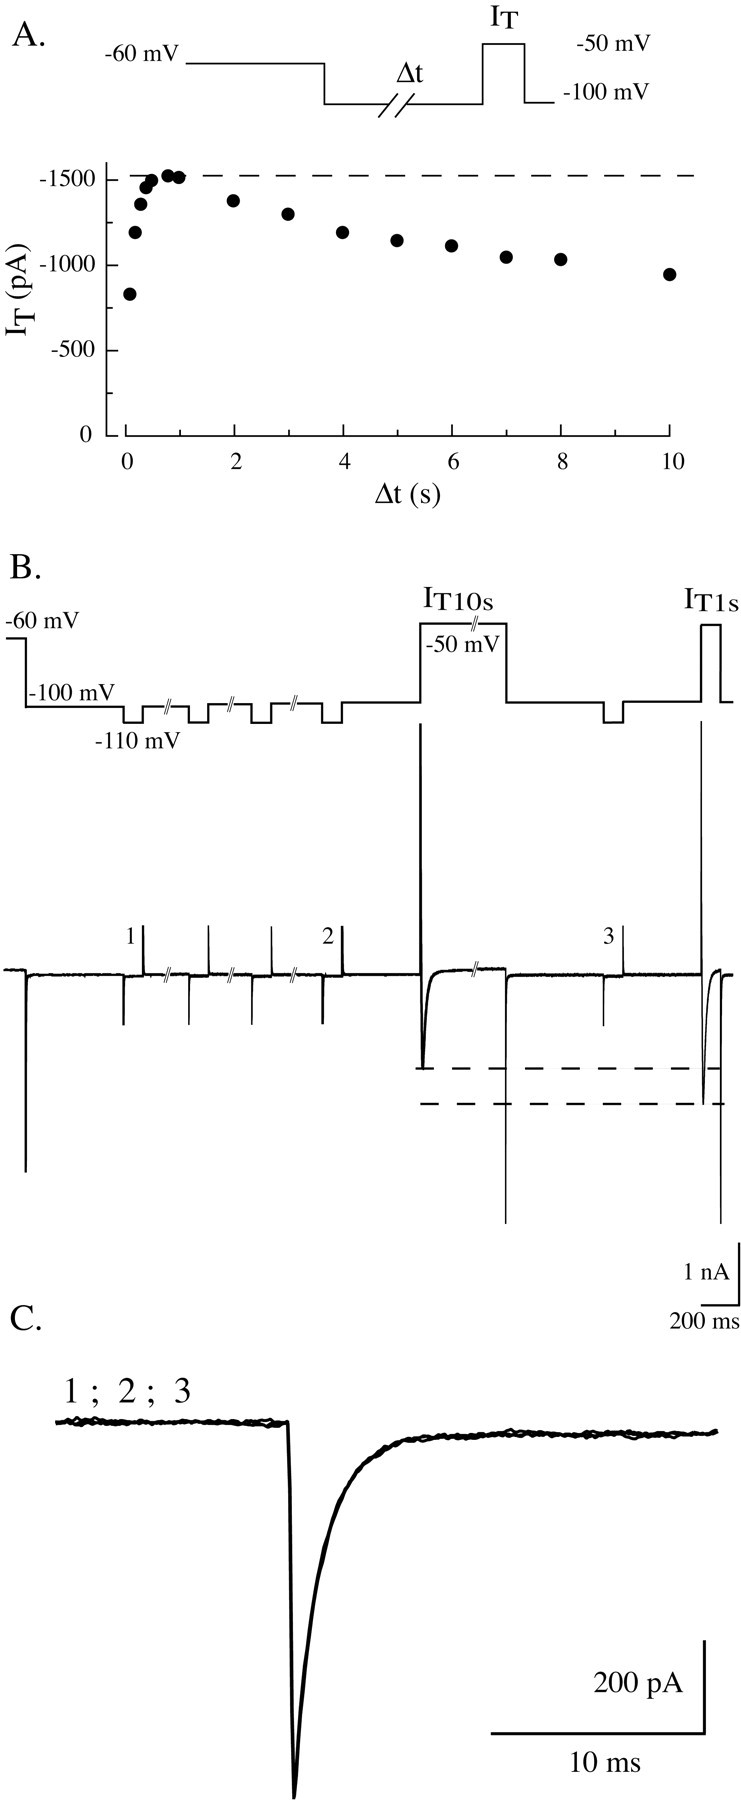
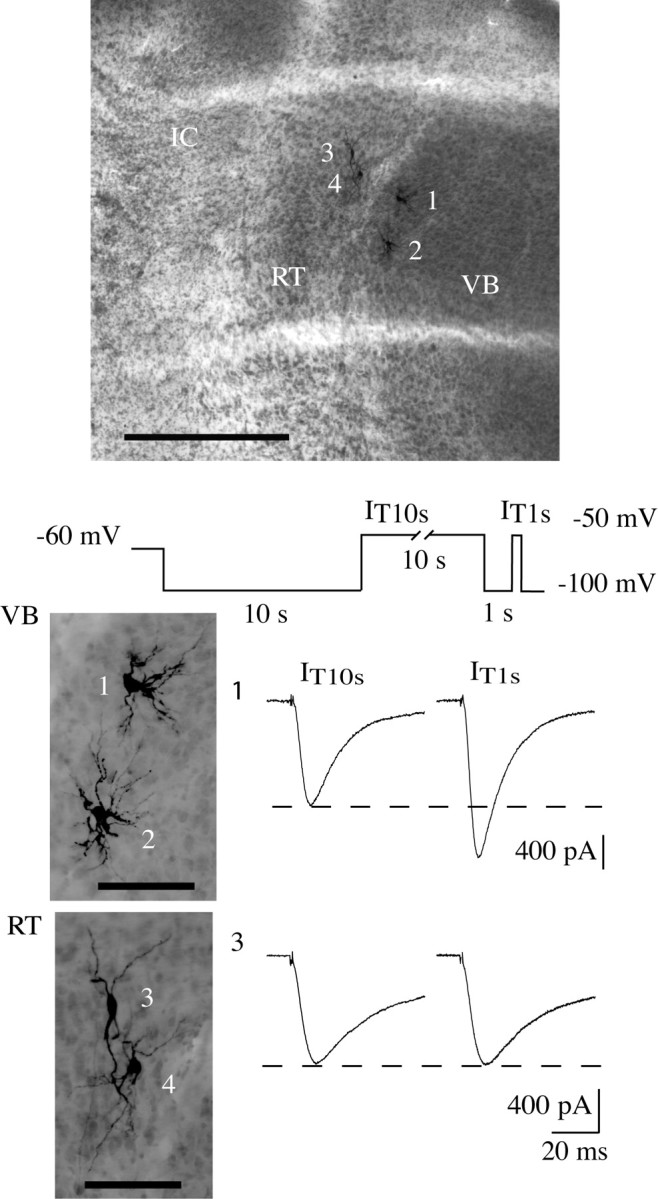
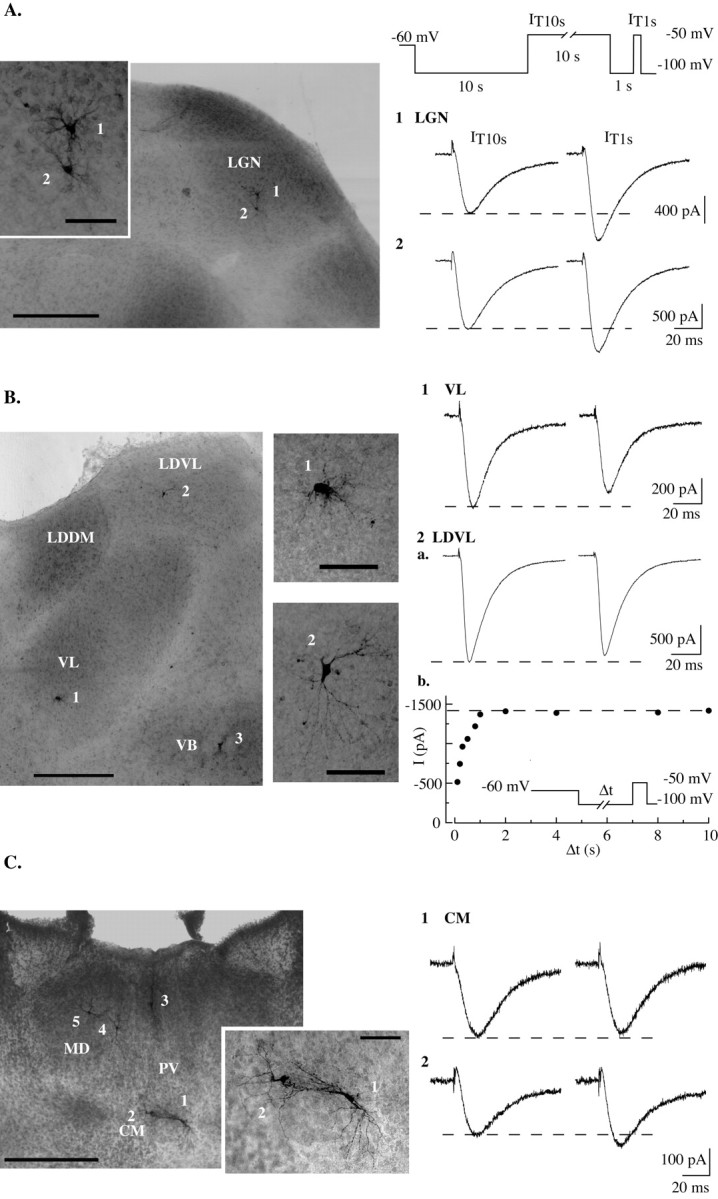
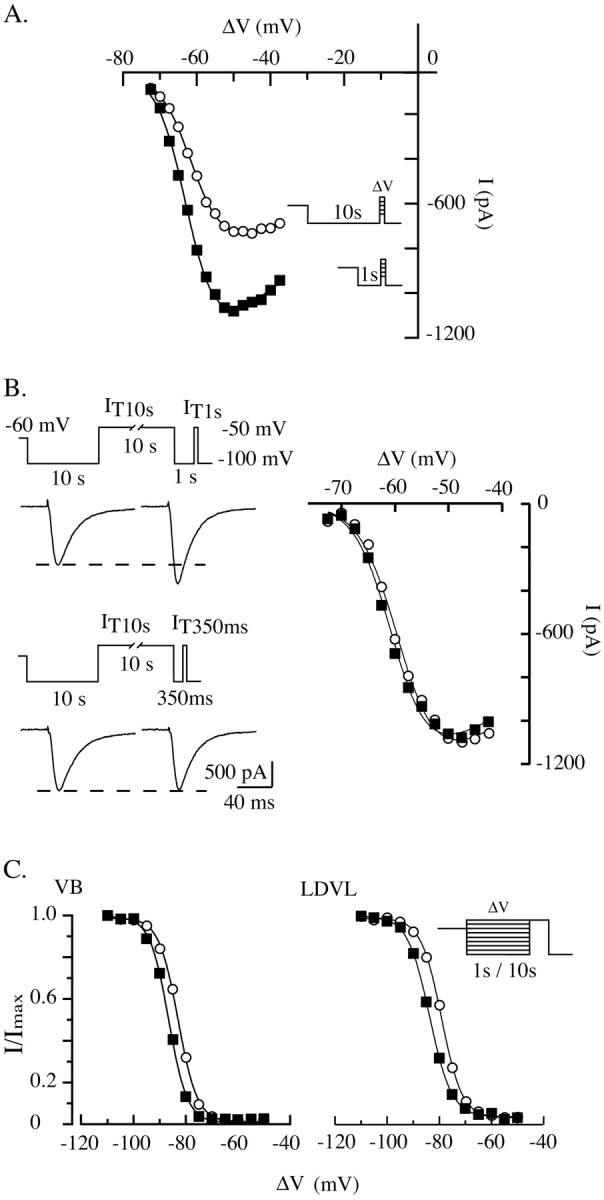
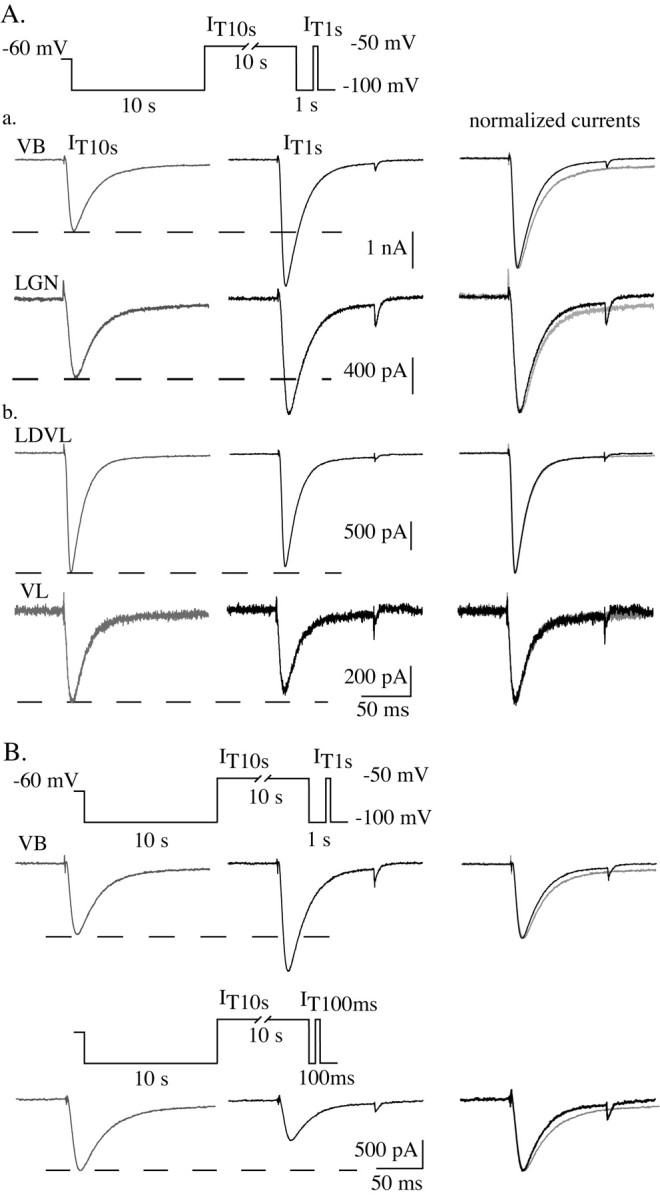
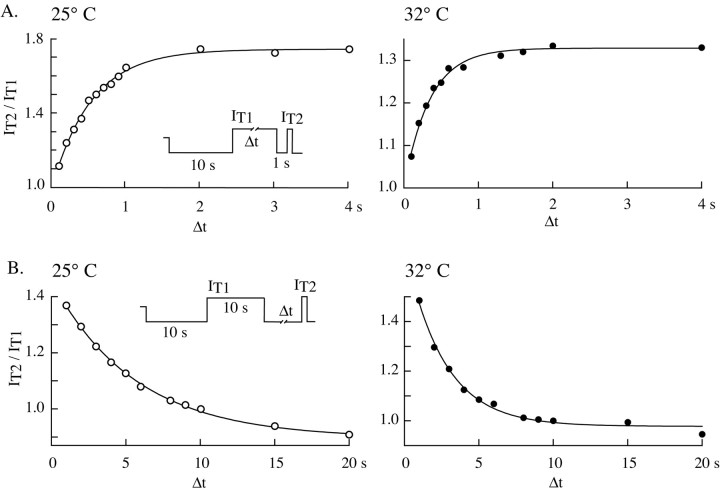
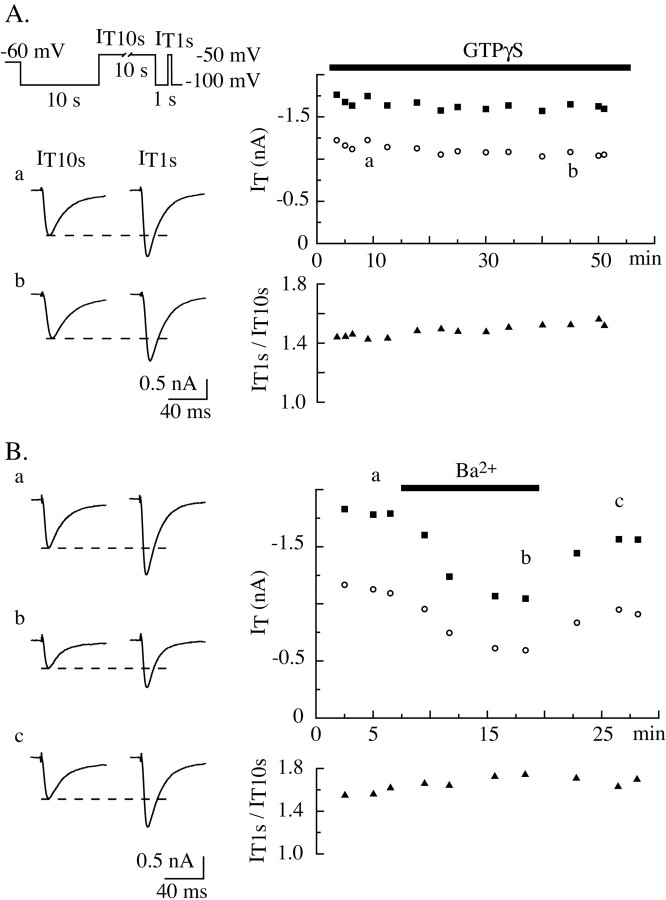
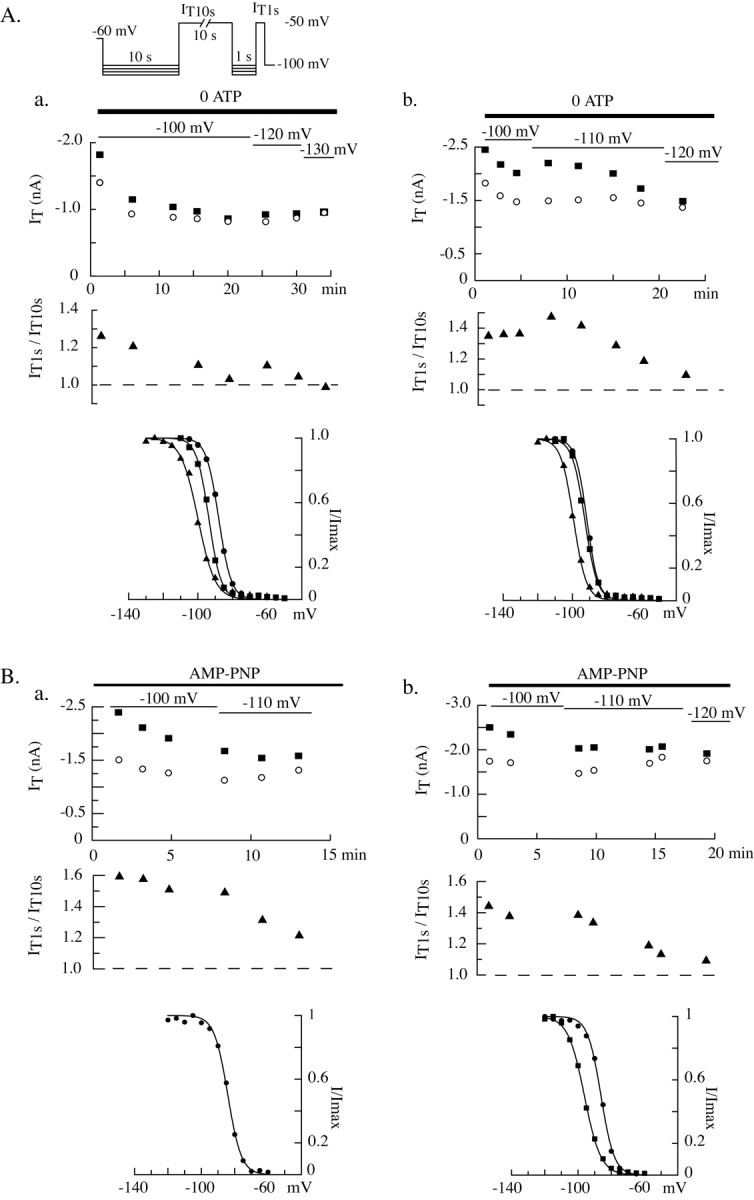
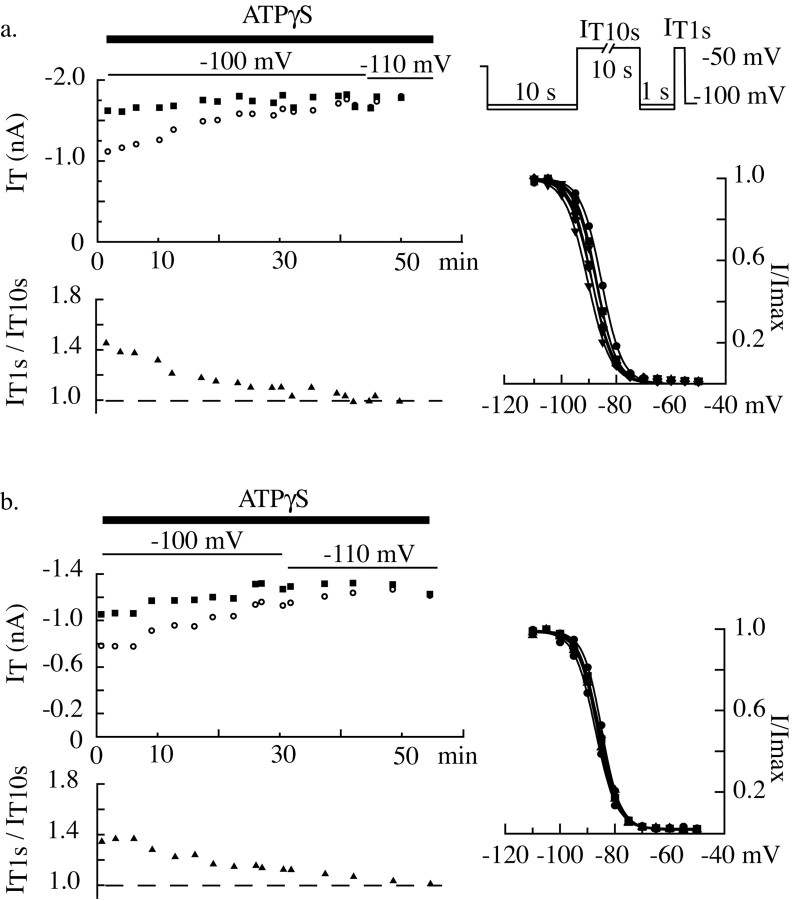
Despite the marked influence on neuronal physiology of the low-voltage activated T-type Ca(2+) currents, little is known about the intracellular pathways and neurotransmitters involved in their regulations. Here, we report that in thalamocortical neurons a phosphorylation mechanism induces an increase both in the current amplitude (1.5 +/- 0.27-fold in the ventrobasal nucleus) and its inactivation kinetics. Dialysis of the neuron with an ATP-free solution suppresses the T-current potentiation, whereas it becomes irreversible in the presence of ATPgammaS. Phosphorylation occurs when the channels are inactivated and is slowly removed when they recover from inactivation and remain in closed states (time constants of the induction and removal of the potentiation: 579 +/- 143 msec and 4.9 +/- 1.1 sec, respectively, at 25 degrees C). The resulting apparent voltage sensitivity of this regulation follows the voltage dependence of the current steady-state inactivation. Thus, the current is paradoxically inhibited when the preceding hyperpolarization is lengthened, and maximal currents are generated after transient hyperpolarizations with a duration (0.7-1.5 sec) that is defined by the balance between the kinetics of the dephosphorylation and deinactivation. In addition, the phosphorylation will facilitate the generation of T current at resting membrane potential. This potentiation, which is specific to sensory thalamocortical neurons, would markedly influence the electroresponsiveness of these neurons and represent the first evidence of a regulation of native Cav3.1 channels.


Figures

Figure 1.
Figure 1.
Anomalous decrease of the amplitude of the T-type current after long hyperpolarizations. A, The graph shows the amplitude of the T current (IT) evoked at -50 mV in a VB neuron as a function of the duration (Δt) of the preceding hyperpolarization to -100 mV (see diagram of protocol). Note the biphasic shape of the curve, with an increase in current amplitude resulting from a progressive recovery from inactivation of the channel population occurring during the first second combined with a slow decrease in current amplitude when the hyperpolarizing prepulse is lengthened. The maximal current is obtained with a 1 sec hyperpolarization. B, Examples of T currents recorded without serial resistance and capacitive compensation or leak current subtraction to test the passive properties of the cell. Note that the VB neuron displays a clear difference in the amplitudes of T currents evoked at -50 mV after either a 10 sec (IT10 sec) or 1 sec (IT1 sec) hyperpolarizing prepulse to -100 mV. The two hyperpolarizations are separated by a 10 sec depolarization to -50 mV (see diagram of the protocol). The passive properties of the cell were monitored during the hyperpolarizing prepulses with 100 msec steps to -110 mV. Capacitive transients evoked during steps 1, 2, and 3 are superimposed in C. Note the stability of both the capacitive transients and the leak currents (-133, -130, and -134 pA, respectively).
Figure 2.
Figure 2.
Voltage-dependent T-type current modulation is present in every ventrobasal neuron but is absent in cells of the reticular nucleus. A typical horizontal thalamic slice (top picture) is presented, where four neurons were recorded and filled with biocytin. Cells 1 and 2 are thalamocortical neurons from the VB nucleus, whereas cells 3 and 4 are from the RT nucleus (transversal white lines were caused by the net used to immobilize the slices during recording). ic, Internal commissure. Scale bar, 500 μm. Note the typical morphology of the two cell populations illustrated in the enlarged pictures (bottom). Scale bar, 100 μm. Current traces recorded in VB neuron 1 and RT neuron 3 at -50 mV preceded either by a 10 sec (IT10 sec; left traces) or a 1 sec (IT1 sec; right traces) prepulse at -100 mV are presented. Note that a 10 sec step depolarization to a potential (-50 mV) at which T channels inactivate separate the two hyperpolarizations (see diagram of the protocol). The current evoked after the short hyperpolarization (IT1 sec) is much larger than that evoked after the long hyperpolarization (IT10 sec) in the VB neuron (same data were obtained with adjacent neuron 2). The two currents recorded in the RT neuron, however, have a similar amplitude (same observations were made on adjacent neuron 4).
Figure 3.
Figure 3.
Voltage-dependent T-type current modulation is a major feature of neurons in sensory thalamic nuclei. Pictures show transversal slices displaying biocytin-filled neurons from different thalamic nuclei with T currents that were studied using the protocols described in Figure 2 (see diagrams of the protocols and Fig. 2 legend). Corresponding current traces are shown on the right. In A, T currents recorded in two adjacent sensory thalamocortical neurons from the dorsal LGN are presented. In both cases the current amplitude obtained after a 1 sec hyperpolarization (IT1 sec) is larger than the one evoked after a 10 sec hyperpolarizing prepulse (IT10 sec). B, Neurons from the VL nucleus, the LDVL nucleus, and the VB nucleus were studied in thesameslice. Note that in both VL and LDVL neurons, IT1 sec is slightly smaller than IT10 sec (1 and 2a) because of an incomplete recovery from inactivation during the 1 sec prepulse and the absence of the T-current regulation described in A. This regulation was present, however, in the VB neuron (cell 3) recorded in the same slice (data not shown). The plot in 2b illustrates the recovery from inactivation measured in the LDVL neuron (see protocol in inset and Fig. 1 A legend), which confirms that the T-current amplitude is stable when increasing the hyperpolarization duration >1 sec in this cell type. Neurons from the intralaminar and median nuclei are presented in C. Two neurons were recorded in the centromedian nucleus (CM) (cells 1 and 2), one in the paraventricular nucleus (PV) (cell 3), and two in the mediodorsal nucleus (MD) (cells 4 and 5). In each nucleus, the T currents displayed characteristics similar to those illustrated for the two adjacent CM neurons: IT1 sec amplitude was either equal (cell 1) or slightly larger (cell 2) than IT10 sec. VLG, Ventral lateral geniculate nucleus; LDDM, laterodorsal dorsomedian nucleus. Scale bars: low-power pictures, 500 μm; enlarged pictures, 100 μm.
Figure 4.
Figure 4.
Voltage sensitivity of the T-type current modulation. The protocol depicted in A was designed to successively compare currents evoked at -50 mV that were conditioned by a 10 sec prepulseat -50 mV (IT2) with the one (IT1) obtained after a 10 sec prepulse of increasing potentials (ΔV) from -100 to -40 mV. Each step depolarization to -50 mV was preceded by a 1 sec hyperpolarization to -100 mV to allow recovery from inactivation. Example of traces obtained with different prepulse potentials are superimposed in A. Note the stability of IT2 but the progressive increase in IT1 amplitude with the increasing prepulse potential and the crisscrossing of the current waveforms caused by the acceleration in the inactivation kinetics. The voltage dependence of the increase in current amplitude was quantified in B by plotting the amplitude ratio IT2/IT1 as a function of the prepulse potential ΔV. Data were fit by a modified Boltzmann equation: a/[1 + exp(-(V -V1/2)/k)]+ b, with V1/2 =-78.4 mV, k = 3.3, a = 0.4, and b = 0.6. Note that the T-current modulation occurs in the voltage range from -90 to -60 mV, which overlaps the voltage range of the steady-state inactivation (Fig. 6).
Figure 6.
Figure 6.
Activation and inactivation voltage dependencies of T-type channels in thalamocortical neurons. A, I-V curves were constructed in the same sensory thalamocortical neurons by successive step depolarizations from -72.5 to -37.5 mV (2.5 mV increments) preceded by either a 10 sec (○) or a 1 sec (▪) hyperpolarizing prepulse to -100 mV (see protocol in inset). The cell was maintained at -60 mV between protocols. Despite the strong increase in current amplitude when 1 sec prepulses are used, the apparent voltage dependence of the channel activation estimated by the two protocols is similar. B, In a neuron displaying a clear decrease in current amplitude after prolonged hyperpolarization (see traces of the currents recorded after 10 and 1 sec hyperpolarizations in the left top graph), prepulse duration was reduced to 350 msec to limit the recovery from inactivation. Note that because of the incomplete recovery from inactivation, the T current evoked at -50 mV after the 350 msec prepulse displays the same amplitude as the current evoked after the prolonged 10 sec prepulse, although the channel activity is facilitated (left bottom graph). Note also that the I-V curves constructed by step depolarizations preceded by 10 sec (○) and 350 msec (•) prepulses are identical, which confirms the absence of effect of the hyperpolarizing prepulse duration on the voltage dependence of the channel activation. C, Inactivation of T channels was induced in a sensory (VB; left graph) and a nonsensory (LDVL; right graph) thalamocortical neuron using either a 10 sec (○) or 1 sec (▪) prepulse of increasing potential (from -110 to -50 mV with 5 mV increments). The resulting channel availability was estimated from the normalized current amplitude measured at -50 mV, and cells were maintained at a holding potential of -60 mV (see protocol in inset). In both the sensory and nonsensory thalamocortical neuron, the apparent voltage dependence of the inactivation was shifted toward more hyperpolarized potentials when 1 sec prepulses were used (see Results for comments). Data were fitted by a Boltzmann equation: 1/[1 + exp(-(V-V1/2)/k)], with V1/2 =-83 mV, k = 3.7 (left graph, ○), -87 mV, 3.6 (left graph, ▪); -79 mV, 3.9 (right graph, ○); -84 mV, 4.2 (right graph, ▪).
Figure 5.
Figure 5.
Depolarization-induced increase in inactivation kinetics of T-type channels in sensory thalamocortical neurons. Traces in A illustrate currents recorded using the standard protocol IT1 sec (left gray traces) versus IT10 sec (middle black traces; see Fig. 2 legend and diagram in A) in two sensory thalamocortical neurons (a) from the VB and LGN nuclei, respectively, and two nonsensory thalamocortical neurons (b) from the LDVL and VL nuclei. In each case, current waveforms were normalized and superimposed (right traces). Both the potentiation and acceleration in the inactivation rate of the currents induced by the depolarization are present only in sensory thalamocortical neurons. Top traces in B show currents recorded in a VB neuron using the same protocol as in A. In the same cell, the protocol was modified by reducing the 1 sec hyperpolarizing period to 100 msec. As a consequence, only a small population of the T channels has recovered from inactivation before the step to -50 mV, resulting in a drastic decrease in current amplitude (bottom traces). As demonstrated by the comparison of the superimposed normalized waveforms (right, top and bottom traces), the inactivation kinetics of the evoked T currents is faster after short than long hyper polarizations, in both cases regardless of the current amplitude.
Figure 7.
Figure 7.
Kinetics of the T-type current amplitude regulation as a function of the prepulse duration. A, Currents evoked at -50 mV (IT1) after a 10 sec hyperpolarizing prepulse to -100 mV were successively compared with those (IT2) obtained after a depolarizing prepulse to -50 mV of increasing duration (Δt; range, 100 msec to 10 sec). In the latter case, a 1 sec hyperpolarization to -100 mV was applied before step depolarization to -50 mV to remove channel inactivation (see protocol in inset). The amplitude ratio IT2/IT1 is presented for two typical neurons recorded either at 25° (left graph) or 32°C (right graph). In both cases, the current is slowly potentiated by depolarizing prepulses of increasing duration, yielding a maximal current for depolarizations >2 sec. Note the fastest kinetics observed at 32°C. Data were fit by a monoexponential function with a time constant of 535 msec (left graph) and 348 msec (right graph). B, Currents evoked at -50 mV (IT2) after a hyperpolarizing prepulse to -100 mV of increasing duration (Δt; range, 1-30 sec) were successively compared with those (IT1) obtained after a 10 sec depolarizing prepulse to -50 mV (see protocol in inset). Plots of the amplitude ratio IT2/IT1 as a function of the hyperpolarization duration are presented for two typical neurons recorded either at 25° (left graph) and 32°C (right graph). The minimal current amplitude is reached with hyperpolarizations >20 sec at 25°C. Note also the slow decrease in current amplitude observed in both cases and the marked acceleration of the kinetics with increasing temperature (time constant of the monoexponential fit: 5.6 and 2.6 sec at 25° and 32°C, respectively).
Figure 8.
Figure 8.
T-type current regulation is G-protein and Ca2+ independent. Comparisons between current amplitudes obtained at -50 mV conditioned by a 10 sec prepulse to either -100 or -50 mV were obtained using the standard protocol IT1 sec versus IT10 sec (Fig. 2 legend and diagram in A). The graphs in A show the time evolution of IT10 sec (right top graph, ○) and IT1 sec (right top graph. ▪) amplitudes and the amplitude ratio IT1 sec/IT10 sec (bottom right graph) in a neuron dialyzed with 100 μm GTPγS. Traces in the left panel are examples of IT10 sec (left traces) and IT1 sec (right traces) currents recorded at two different times (indicated by a and b in the right top graph) during the experiment. Note the stability of the current amplitudes. B shows the results of a similar experiment performed in a neuron transiently perfused with an extracellular solution in which Ca2+ was replaced by Ba2+. Note the parallel and reversible decrease in amplitude of IT10 sec (top plot, ○) and IT1 sec (top plot, ▪) during perfusion with the Ba2+ solution but the stability of IT1 sec/IT10 sec (bottom plot, ▴) during the experiment.
Figure 9.
Figure 9.
ATP is required for the T-type current regulation. Using the same protocol as in Figure 8, the phosphorylation requirements were investigated. IT10 sec (left graph, open circle) and IT1 sec (left graph, filled square) and the ratio IT1 sec/IT10 sec (left graph, ▴) were measured during dialysis of the intracellular medium with either an ATP-free solution (Aa, Ab) or a solution containing 4 mm AMP-PNP (Ba, Bb). To avoid possible artifacts induced by a shift in the voltage dependence of the steady-state inactivation after dialysis with these solutions, more negative voltages were progressively used during the hyperpolarizing prepulses (values indicated in the top graphs). Bottom graphs present the inactivation-voltage relationships measured with 1 sec prepulses (see protocol details in Fig. 6) at different times during the experiment (cell Aa: circles 3 min, squares 20 min, triangles 33 min; cell Ab: circles 6 min, squares 13 min, triangles 23 min; cell Ba: circles 13 min; cell Bb: circles 5 min, squares 17 min). Note the rundown of the current amplitude and the shift in inactivation toward more hyperpolarized potential. The progressively stronger decrease in IT1 sec than in IT10 sec amplitude results in a superimposition of the two current amplitudes toward the end of the experiment and is indicative of the loss of the T-current regulation.
Figure 10.
Figure 10.
The T-type current potentiation depends on protein phosphorylation occurring when channels are inactivated. Protocols are similar to those in Figure 9. Graphs illustrate typical data obtained in two neurons (a, b) during dialysis with an intracellular solution containing 4 mm ATPγS. Note the progressive increase in current amplitude that is markedly stronger for IT10 sec than IT1 sec, and the identity of the two current amplitudes (see Results for comments). The last inactivation protocols (right graphs) were performed 51 and 55 min after patch rupture in neurons a and b, respectively. The shift of the inactivation curve toward hyperpolarized potentials is smaller and occurs later than when recording with an ATP-free solution.

Similar articles

Cited by

References

    1. Alvarez JL, Rubio LS, Vassort G (1996) Facilitation of T-type calcium current in bullfrog atrial cells: voltage-dependent relief of a G protein inhibitory tone. J Physiol (Lond) 491: 321-334. - PMC - PubMed
    1. Alvarez JL, Artiles A, Talavera K, Vassort G (2000) Modulation of voltage-dependent facilitation of the T-type calcium current by sodium ion in isolated frog atrial cells. Pflügers Arch 441: 39-48. - PubMed
    1. Arnoult C, Villaz M, Florman HM (1998) Pharmacological properties of the T-type Ca2+ current of mouse spermatogenic cells. Mol Pharmacol 53: 1104-1111. - PubMed
    1. Artalejo CR, Rossie S, Perlman RL, Fox AP (1992) Voltage-dependent phosphorylation may recruit Ca2+ current facilitation in chromaffin cells. Nature 358: 63-66. - PubMed
    1. Bean BP (1989) Neurotransmitter inhibition of neuronal calcium currents by changes in channel voltage dependence. Nature 340: 153-156. - PubMed

Publication types

Substances

LinkOut - more resources