

The effect of MR scanner noise on auditory cortex activity using fMRI
- PMID: 15202112
- PMCID: PMC6871718
- DOI: 10.1002/hbm.20043
The effect of MR scanner noise on auditory cortex activity using fMRI
Abstract
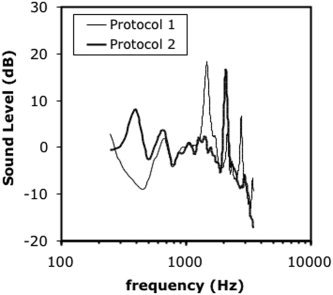
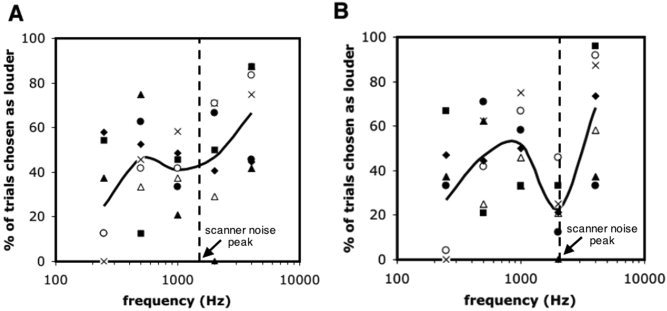
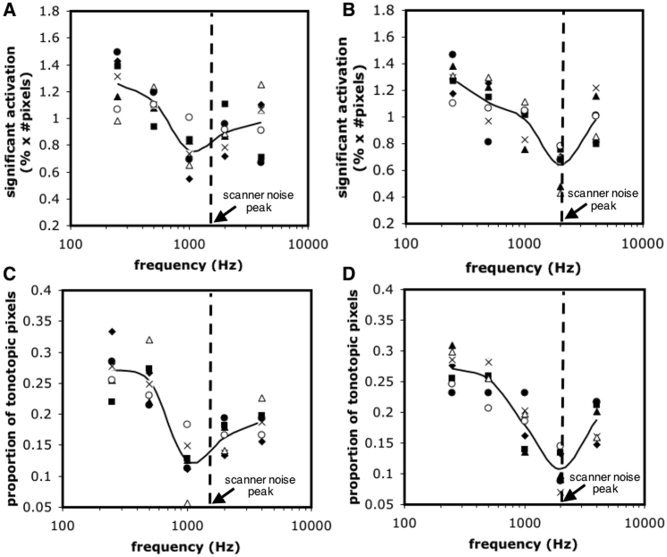
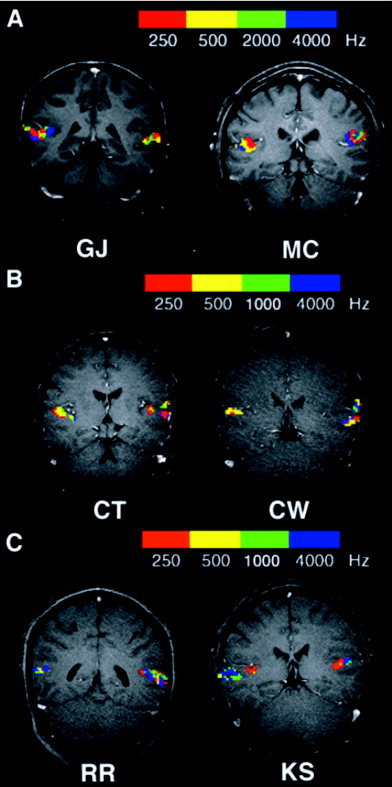
Auditory functional magnetic resonance imaging (fMRI) studies are limited by the presence of noise produced by echo planar imaging (EPI). The current study quantifies the effect of MR scanner noise on psychophysical measures of the perception of loudness and on measures of tonotopy, the representation of auditory frequencies within the auditory cortex. Seven normal hearing adults were examined using tones of 5 different auditory frequencies (250, 500, 1,000, 2,000, 4,000 Hz) of equal loudness. Using an imaging protocol with peak MR scanner noise at 1,460 Hz, the perception of loudness and detectable fMRI activity in response to a 1-kHz tone was less compared to other frequencies. When the imaging protocol was changed such that peak MR scanner noise occurred at 2,080 Hz, the perception of loudness and detectable fMRI activity in response to a 2-kHz tone was less compared to other frequencies. The reduction in the measured fMRI activity for tones near scanner frequencies may be due to an inflated scanner-induced baseline at those frequencies. In addition, fMRI activity decreased with increasing frequency, possibly due to the upward spread of masking of low-frequency, high-intensity tonal stimuli or the proximity of low-frequency core and belt areas of the auditory cortex. These results demonstrate the direct effect of scanner noise and high-intensity tonal stimuli on measurements of auditory cortex tonotopy.
Copyright 2004 Wiley-Liss, Inc.
Figures
Similar articles
-
Auditory intensity processing: Effect of MRI background noise.Hear Res. 2016 Mar;333:87-92. doi: 10.1016/j.heares.2016.01.007. Epub 2016 Jan 15. Hear Res. 2016. PMID: 26778471
-
Interactions between hemodynamic responses to scanner acoustic noise and auditory stimuli in functional magnetic resonance imaging.Magn Reson Med. 2005 Jan;53(1):49-60. doi: 10.1002/mrm.20315. Magn Reson Med. 2005. PMID: 15690502
-
Functional MR of the primary auditory cortex: an analysis of pure tone activation and tone discrimination.AJNR Am J Neuroradiol. 1997 Apr;18(4):601-10. AJNR Am J Neuroradiol. 1997. PMID: 9127019 Free PMC article.
-
fMRI of the auditory system: understanding the neural basis of auditory gestalt.Magn Reson Imaging. 2003 Dec;21(10):1213-24. doi: 10.1016/j.mri.2003.08.023. Magn Reson Imaging. 2003. PMID: 14725929 Review.
-
Auditory system: functional magnetic resonance imaging.Neuroimaging Clin N Am. 2001 May;11(2):275-96, ix. Neuroimaging Clin N Am. 2001. PMID: 11489740 Review.
Cited by
-
Assessing the influence of scanner background noise on auditory processing. I. An fMRI study comparing three experimental designs with varying degrees of scanner noise.Hum Brain Mapp. 2007 Aug;28(8):703-20. doi: 10.1002/hbm.20298. Hum Brain Mapp. 2007. PMID: 17080440 Free PMC article.
-
Mapping the tonotopic organization in human auditory cortex with minimally salient acoustic stimulation.Cereb Cortex. 2012 Sep;22(9):2024-38. doi: 10.1093/cercor/bhr282. Epub 2011 Oct 6. Cereb Cortex. 2012. PMID: 21980020 Free PMC article.
-
Lateralization of music processing with noises in the auditory cortex: an fNIRS study.Front Behav Neurosci. 2014 Dec 9;8:418. doi: 10.3389/fnbeh.2014.00418. eCollection 2014. Front Behav Neurosci. 2014. PMID: 25538583 Free PMC article.
-
Decoding Multiple Sound-Categories in the Auditory Cortex by Neural Networks: An fNIRS Study.Front Hum Neurosci. 2021 Apr 28;15:636191. doi: 10.3389/fnhum.2021.636191. eCollection 2021. Front Hum Neurosci. 2021. PMID: 33994978 Free PMC article.
-
Cortical field maps across human sensory cortex.Front Comput Neurosci. 2023 Dec 15;17:1232005. doi: 10.3389/fncom.2023.1232005. eCollection 2023. Front Comput Neurosci. 2023. PMID: 38164408 Free PMC article. Review.
References
-
- Bandettini PA, Wong EC (1997): Magnetic resonance imaging of human brain function. Principles, practicalities, and possibilities. Neurosurg Clin N Am 8: 345–371. - PubMed
-
- Bandettini PA, Jesmanowicz A, Van Kylen J, Birn RM, Hyde JS (1998): Functional MRI of brain activation induced by scanner acoustic noise. Magn Reson Med 39: 410–416. - PubMed
-
- Belin P, Zatorre RJ, Hoge R, Evans AC, Pike B (1999): Event‐related fMRI of the auditory cortex. Neuroimage 10: 417–429. - PubMed
-
- Bertrand O, Perrin F, Pernier J (1991): Evidence for a tonotopic organization of the auditory cortex observed with auditory evoked potentials. Acta Otolaryngol (Suppl) 491: 116–122. - PubMed
-
- Bilecen D, Radu EW, Scheffler K (1998a): The MR tomograph as a sound generator: fMRI tool for the investigation of the auditory cortex. Magn Reson Med 40: 934–937. - PubMed
Publication types
MeSH terms
LinkOut - more resources
Full Text Sources
Medical
