Evidence for a significant urbanization effect on climate in China
- PMID: 15205480
- PMCID: PMC470710
- DOI: 10.1073/pnas.0400357101
Evidence for a significant urbanization effect on climate in China
Abstract
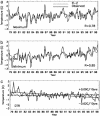
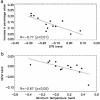
China has experienced rapid urbanization and dramatic economic growth since its reform process started in late 1978. In this article, we present evidence for a significant urbanization effect on climate based on analysis of impacts of land-use changes on surface temperature in southeast China, where rapid urbanization has occurred. Our estimated warming of mean surface temperature of 0.05 degrees C per decade attributable to urbanization is much larger than previous estimates for other periods and locations. The spatial pattern and magnitude of our estimate are consistent with those of urbanization characterized by changes in the percentage of urban population and in satellite-measured greenness.
Figures


References
-
- Intergovernmental Panel on Climate Change (2001) in Climate Change 2001: The Scientific Basis, eds. Houghton, J. T., Ding, Y., Griggs, D. J., Noguer, M., van der Linden, P. J., Dai, X., Maskell, K. & Johnson, C. A. (Cambridge Univ. Press, Cambridge, U.K.).
-
- Jones, P. D., Groisman, P. Ya., Coughlan, M., Plummer, N., Wang, W.-C. & Karl, T. R. (1990) Nature 347, 169-172.
-
- Easterling, D. R., Horton, B., Jones, P. D., Peterson, T. C., Karl, T. R., Parker, D. E., Salinger, M. J., Razuvayev, V., Plummer, N., Jamason, P., et al. (1997) Science 277, 364-367.
-
- Karl, T. R., Jones, P. D., Knight, R. W., Kukla, G., Plummer, N., Razuvayev, V., Gallo, K. P., Lindseay, J., Charlson, R. J. & Peterson, T. C. (1993) Bull. Am. Meteorol. Soc. 74, 1007-1024.
-
- Hansen, J., Ruedy, R., Sato, Mki., Imhoff, M., Lawrence, W., Easterling, D., Peterson, T. & Karl, T. (2001) J. Geophys. Res. 106, 23947-23963.
Publication types
MeSH terms
LinkOut - more resources
Full Text Sources

