The worldwide costs of marine protected areas
- PMID: 15205483
- PMCID: PMC470737
- DOI: 10.1073/pnas.0403239101
The worldwide costs of marine protected areas
Abstract
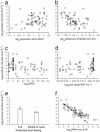
Declines in marine harvests, wildlife, and habitats have prompted calls at both the 2002 World Summit on Sustainable Development and the 2003 World Parks Congress for the establishment of a global system of marine protected areas (MPAs). MPAs that restrict fishing and other human activities conserve habitats and populations and, by exporting biomass, may sustain or increase yields of nearby fisheries. Here we provide an estimate of the costs of a global MPA network, based on a survey of the running costs of 83 MPAs worldwide. Annual running costs per unit area spanned six orders of magnitude, and were higher in MPAs that were smaller, closer to coasts, and in high-cost, developed countries. Models extrapolating these findings suggest that a global MPA network meeting the World Parks Congress target of conserving 20-30% of the world's seas might cost between 5 billion and 19 billion US dollars annually to run and would probably create around one million jobs. Although substantial, gross network costs are less than current government expenditures on harmful subsidies to industrial fisheries. They also ignore potential private gains from improved fisheries and tourism and are dwarfed by likely social gains from increasing the sustainability of fisheries and securing vital ecosystem services.
Figures


Similar articles
-
Global conservation outcomes depend on marine protected areas with five key features.Nature. 2014 Feb 13;506(7487):216-20. doi: 10.1038/nature13022. Epub 2014 Feb 5. Nature. 2014. PMID: 24499817
-
Predicting Consumer Biomass, Size-Structure, Production, Catch Potential, Responses to Fishing and Associated Uncertainties in the World's Marine Ecosystems.PLoS One. 2015 Jul 30;10(7):e0133794. doi: 10.1371/journal.pone.0133794. eCollection 2015. PLoS One. 2015. PMID: 26226590 Free PMC article.
-
Capacity shortfalls hinder the performance of marine protected areas globally.Nature. 2017 Mar 30;543(7647):665-669. doi: 10.1038/nature21708. Epub 2017 Mar 22. Nature. 2017. PMID: 28329771
-
Missing marine protected area (MPA) targets: How the push for quantity over quality undermines sustainability and social justice.J Environ Manage. 2013 Jul 30;124:137-46. doi: 10.1016/j.jenvman.2013.01.033. Epub 2013 Apr 10. J Environ Manage. 2013. PMID: 23582739 Review.
-
Marine protected areas in Sri Lanka: a review.Environ Manage. 2007 Nov;40(5):727-38. doi: 10.1007/s00267-005-0154-x. Epub 2007 Oct 9. Environ Manage. 2007. PMID: 17929086 Review.
Cited by
-
A Graph Theory approach to assess nature's contribution to people at a global scale.Sci Rep. 2021 Apr 27;11(1):9118. doi: 10.1038/s41598-021-88745-z. Sci Rep. 2021. PMID: 33907282 Free PMC article.
-
Economic valuation for policy support in the context of ecosystem-based adaptation to climate change: An indicator, integrated based approach.Heliyon. 2020 Aug 21;6(8):e04650. doi: 10.1016/j.heliyon.2020.e04650. eCollection 2020 Aug. Heliyon. 2020. PMID: 32904292 Free PMC article.
-
A global evaluation of coral reef management performance: are MPAs producing conservation and socio-economic improvements?Environ Manage. 2011 Apr;47(4):684-700. doi: 10.1007/s00267-011-9616-5. Epub 2011 Mar 2. Environ Manage. 2011. PMID: 21365274
-
A global network of marine protected areas for food.Proc Natl Acad Sci U S A. 2020 Nov 10;117(45):28134-28139. doi: 10.1073/pnas.2000174117. Epub 2020 Oct 26. Proc Natl Acad Sci U S A. 2020. Retraction in: Proc Natl Acad Sci U S A. 2021 Oct 26;118(43):e2117750118. doi: 10.1073/pnas.2117750118. PMID: 33106411 Free PMC article. Retracted.
-
Preference classes in society for coastal marine protected areas.PeerJ. 2019 Apr 23;7:e6672. doi: 10.7717/peerj.6672. eCollection 2019. PeerJ. 2019. PMID: 31065453 Free PMC article.
References
-
- Pauly, D., Christensen, V., Guenette, S., Pitcher, T. R., Sumaila, U. R., Walters, C. J., Watson, R. & Zeller, D. (2002) Nature 418, 689-695. - PubMed
-
- Hutchings, J. A. (2000) Nature 406, 882-884. - PubMed
-
- Jackson, J. B. C., Kirby, M. X., Berger, W. H., Bjorndal, K. A., Botsford, L. W., Bourque, B. J., Bradbury, R. H., Cooke, R., Erlandson, J., Estes, J. A., et al. (2001) Science 293, 629-638. - PubMed
-
- Baum, J. K., Myers, R. A., Kehler, D. G., Worm, B., Harley, S. J. & Doherty, P. A. (2003) Science 299, 389-392. - PubMed
-
- Myers, R. A. & Worm, B. (2003) Nature 423, 280-283. - PubMed
Publication types
MeSH terms
LinkOut - more resources
Full Text Sources

