. 2004 Jun 18;304(5678):1797-800.
doi: 10.1126/science.1099754.

Dynamics of single mRNPs in nuclei of living cells

Affiliations

Dynamics of single mRNPs in nuclei of living cells

Yaron Shav-Tal et al. Science. .

Abstract

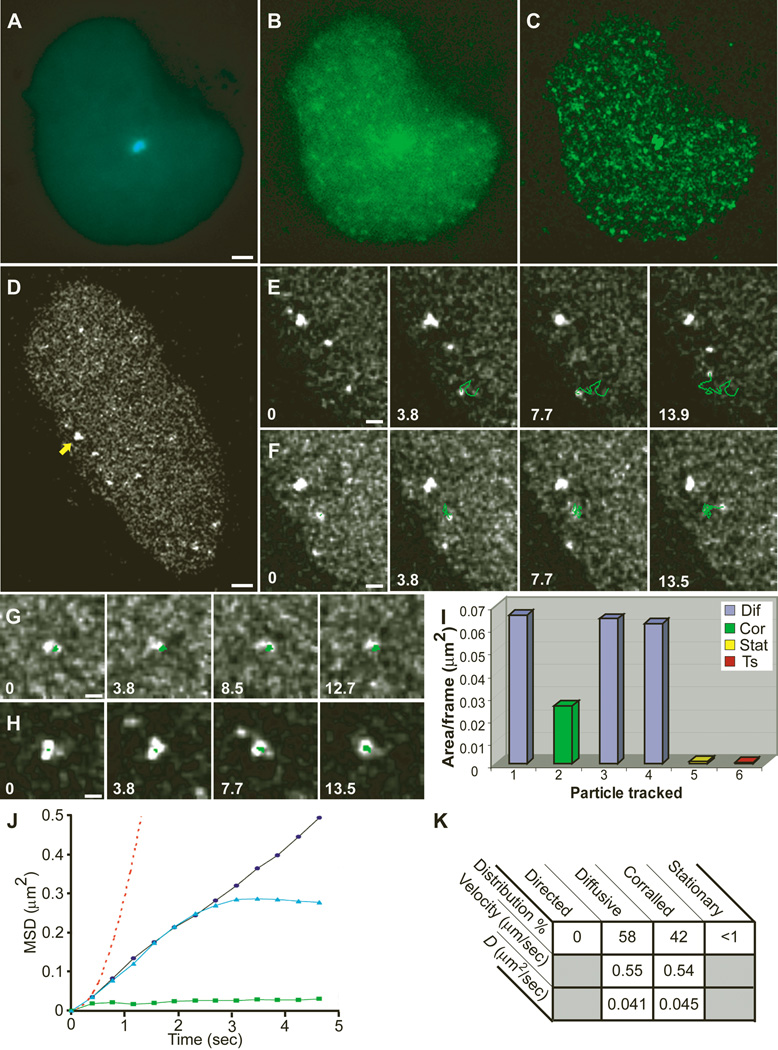
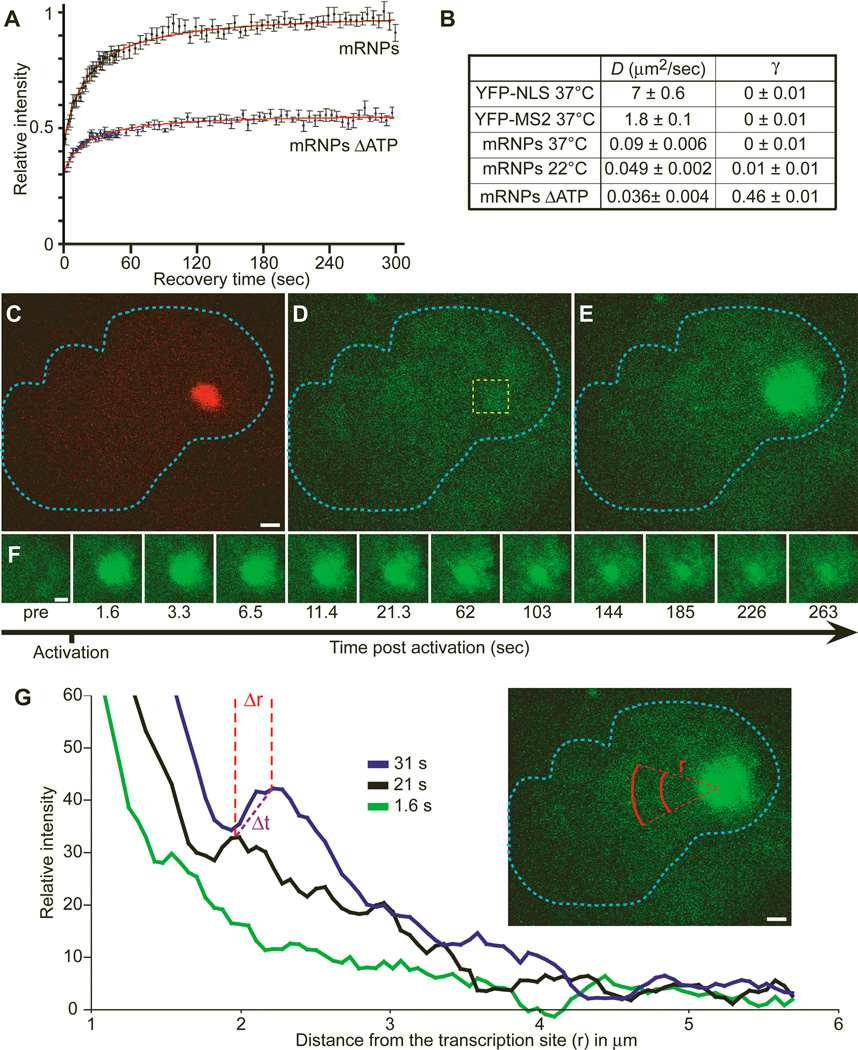
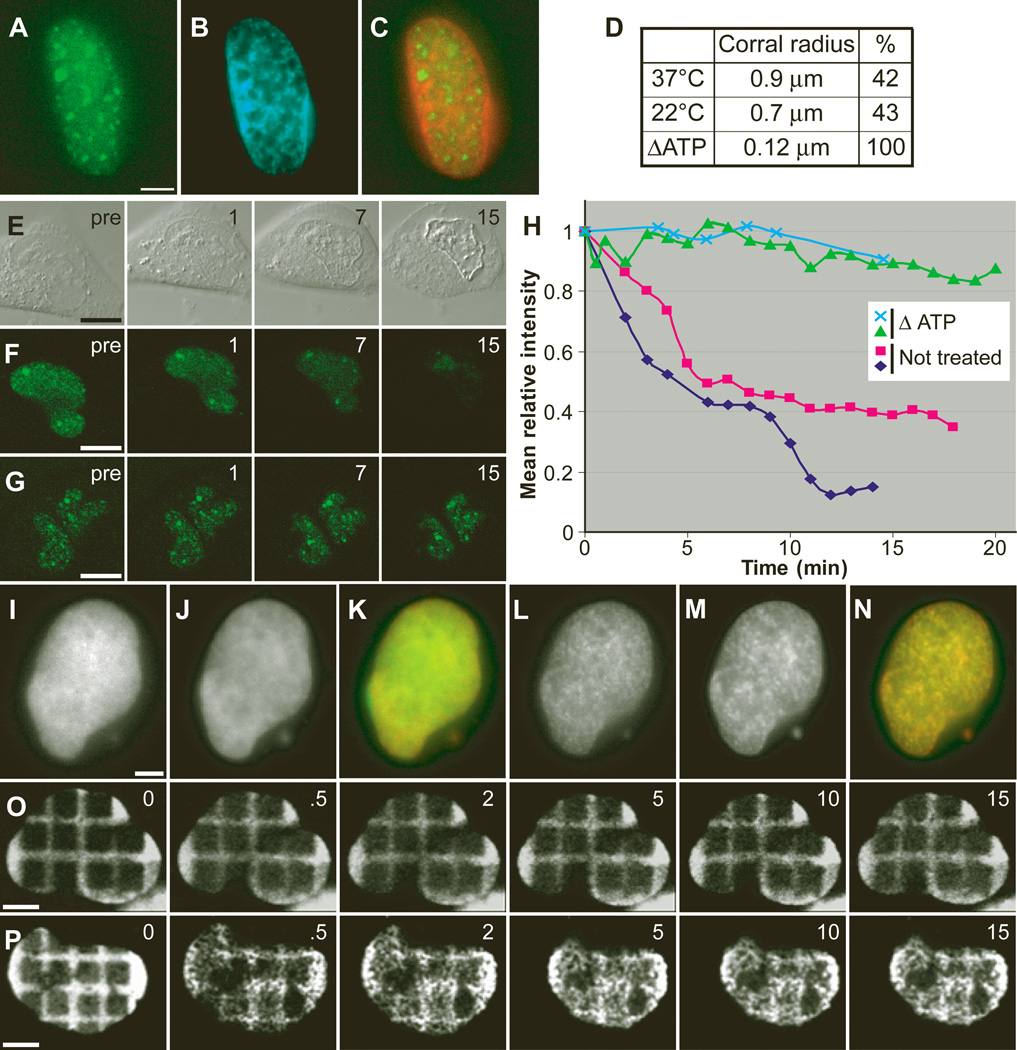
Understanding gene expression requires the ability to follow the fate of individual molecules. Here we use a cellular system for monitoring messenger RNA (mRNA)expression to characterize the movement in real time of single mRNA-protein complexes (mRNPs) in the nucleus of living mammalian cells. This mobility was not directed but was governed by simple diffusion. Some mRNPs were partially corralled throughout the nonhomogenous nuclear environment, but no accumulation at subnuclear domains was observed. Following energy deprivation, energy-independent motion of mRNPs was observed in a highly ATP-dependent nuclear environment; movements were constrained to chromatin-poor domains and excluded by newly formed chromatin barriers. This observation resolves a controversy, showing that the energetic requirements of nuclear mRNP trafficking are consistent with a diffusional model.


Figures

Fig. 1
Fig. 1
Live-cell imaging and single-particle tracking of individual mRNPs. Images from time-lapse movies acquired from a cell cotransfected with(A) CFP-lac repressor and (B) YFP-MS2 and induced for more than 30 min. (C) Reduction of noise for tracking of mRNPs was obtained by deconvolution. Bar, 2 µm. (D) Tracking of mRNP particles in a transcriptionally active cell induced for only 20 min (arrow, transcription site) (bar, 2 µm) [Movie S6 (5)] showed (E) diffusing particles [Movie S7 (5)], (F) corralled particles [Movie S8 (5)], (G) stationary particles, and (H) the transcription site. Tracks are marked in green, and time in seconds from the beginning of tracking for eachparticle appears in each frame. Bars, 1 µm. (I) Plot of the area per frame in which each of the tracked particles from this particular cell traveled throughout the tracking period. Diffusive particles are in blue, corralled in green, stationary in yellow, and transcription site in red. Particle 1, particle seen in E; 2, F; 5, G; 6, H. (J) Mean-square displacement (MSD) of tracked nucleoplasmic particles versus time indicated the presence of three types of characterized movements: diffusive (black circles), corralled (blue triangles), and stationary (green squares). Directed movement was never detected (red dotted line; plotted from data of tracked directed cytoplasmic particles). (K) Table summarizing the mean velocities and diffusion coefficients of tracked particles at 37°C. %, percent of tracked particles. Ddiffusion coefficient.
Fig. 2
Fig. 2
FRAP and photoactivation of labeled RNPs. (A) FRAP performed on cells cotransfected with pTet-On and YFP-MS2 and induced for 30 to 60 min with doxycycline. Cells either remained untreated or were ATP depleted for 30 min. Recovery of the bleached signal is shown. (B) Comparison of the calculated diffusion rates (D) and fixed fractions (γ) for free YFP-NLS, free YFP-MS2, mRNPs at different temperatures, and mRNPs in ATP-depleted cells. (C to E) A cell in which the photoactivatable MS2-GFP (MS2-paGFP) gene was stably integrated (2-3-6-PA) was cotransfected with RFP-lac repressor and pTet-On. Transcription was induced for 30 min by doxycycline. The locus was detected (red) prior to photoactivation (C), and the image in GFP before activation was recorded (D). The 405-nm laser was directed at the boxed region of interest (yellow), and the MS2-paGFP was detected at the transcription site 1.635 s after activation (E). Bar, 2 µm. (F) The RNP signal emanating from the transcription site was followed for 262 s (bar, 2 µm) [Movie S11 (5)]. (G) To quantify the movement of the mRNPs, we measured concentric arcs at various distances (r) from the transcription site, as indicated in red, and plotted the normalized (to preactivation value) average intensities per pixel for each arc. The three plots represent three examples of time points (green, 1.635 s; black, 21.255 s; blue, 31.065 s). The distances between the peaks of the signal wave (Δr) were calculated over time (Δt) and the diffusion coefficients determined.
Fig. 3
Fig. 3
Effect of energy depletion on mRNP movement. (A to C) A transfected and transcriptionally induced cell, 10 min after energy depletion. (A) Concentrated YFP-MS2 nuclear mRNPs; (B) Hoechst DNA stain; (C) Merge of YFP-MS2 mRNPs from (A) in green and Hoechst from (B) in red, showing segregation into two domains [movies S12 to S14 (5)]. (D) Table summarizing the corral radius measured for corralled particles tracked at 37°C, 22°C, and ATP-depleted cells. %, percent of corralled particles from total tracked. (E to G) Cells treated with 0.02% Triton (pre, before Triton; 1, 7, and 15 s, after Triton). (E) Differential interference contrast image. (F) YFP-MS2 labeled mRNPs are lost from the nucleus during permeabilization (time in minutes). (G) Same as (F), but the cells were first energy depleted and then permeabilized, and mRNP loss is slower. (H) Plots of the mean fluorescence intensity over time in the nucleus of permeabilized cells, treated as in (F) (red and dark blue lines) or as in (G) (green and light blue lines). (I) Cell expressing H2B-YFP and (J) counterstained with Hoechst. (K) Merge of (I) and (J). (L to N) The same cell 10 min after ATP depletion, showing the formation of nuclear subdomains. Bar, 5 µm. [movies 15 to 17 (5)]. (O) Time course of a cell transfected with H2B-YFP in which squares have been photobleached to form a grid (times are in minutes). (P) Same time course as in O, but ATP was depleted at time 0 min, showing major changes in chromatin structure together with nuclear shrinkage [movie S18 (5)]. Bar, 5 µm.

Similar articles

Cited by

References

    1. Fusco D, et al. Curr. Biol. 2003;13:161. - PMC - PubMed
    1. Janicki SM, et al. Cell. 2004;116:683. - PMC - PubMed
    1. Materials, methods, and additional data are available ?as supporting material on Science Online
    1. Tsukamoto T, et al. Nature Cell Biol. 2000;2:871. - PubMed
    1. Movies S1 to S23 are available at http://singerlab.org/supplements/science_v304p1797.

Publication types

MeSH terms