. 2004 Jun;135(2):773-82.
doi: 10.1104/pp.104.042176.

Genome-wide ORFeome cloning and analysis of Arabidopsis transcription factor genes

Affiliations

Genome-wide ORFeome cloning and analysis of Arabidopsis transcription factor genes

Wei Gong et al. Plant Physiol. 2004 Jun.

Abstract

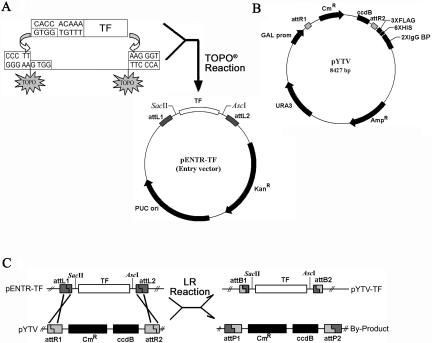
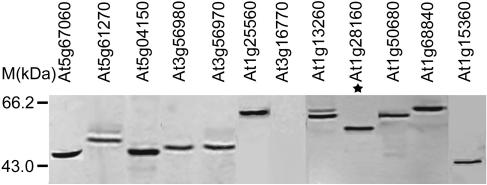
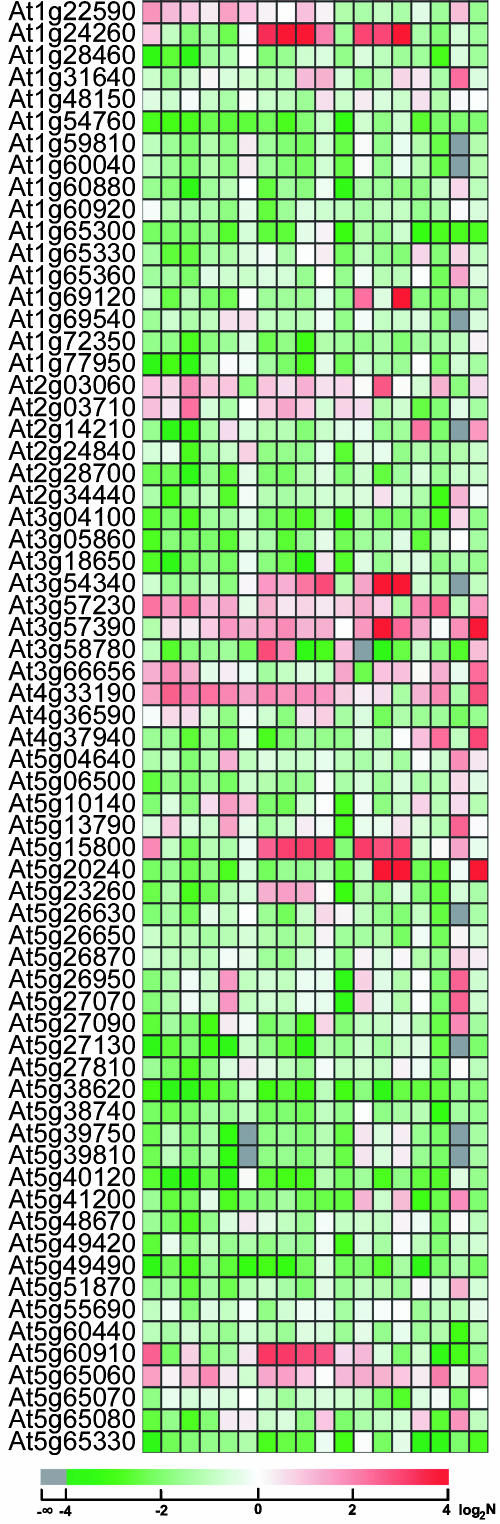
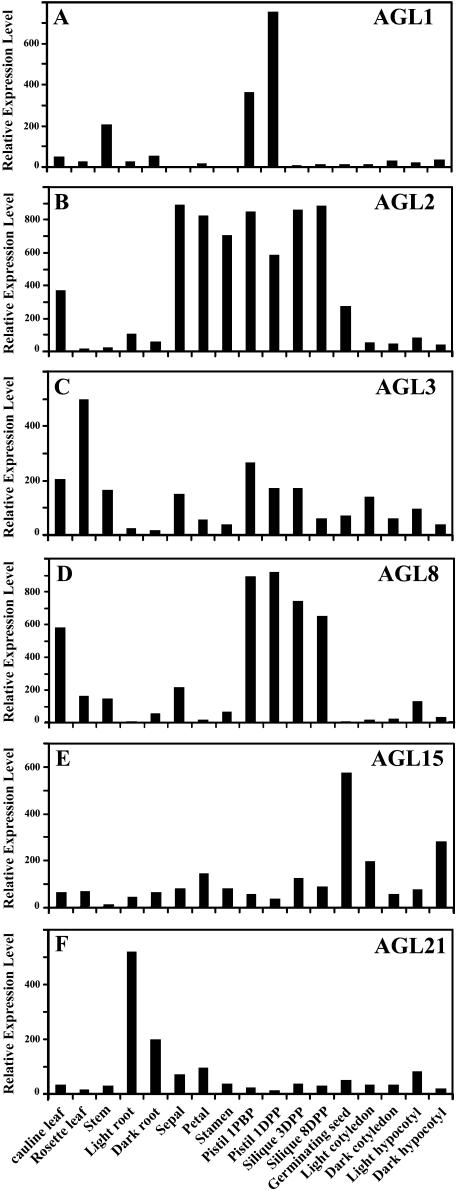
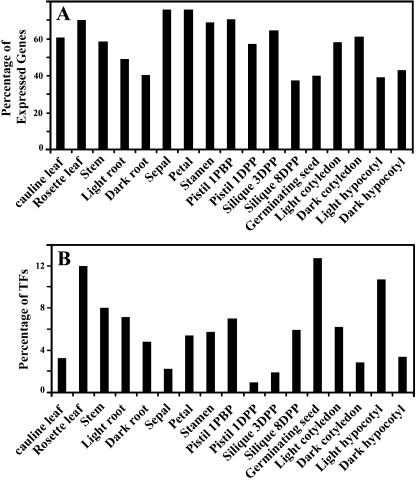
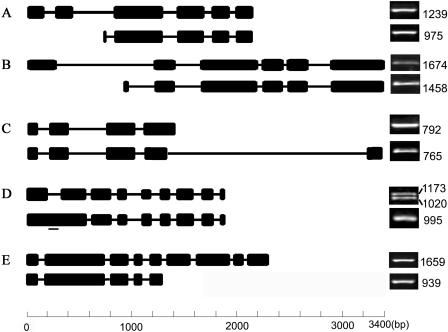
Here, we report our effort in generating an ORFeome collection for the Arabidopsis transcription factor (TF) genes. In total, ORFeome clones representing 1,282 Arabidopsis TF genes have been obtained in the Gateway high throughput cloning pENTR vector, including 411 genes whose annotation lack cDNA support. All the ORFeome inserts have also been mobilized into a yeast expression destination vector, with an estimated 85% rate of expressing the respective proteins. Sequence analysis of these clones revealed that 34 of them did not match with either the reported cDNAs or current predicted open-reading-frame sequences. Among those, novel alternative splicing of TF gene transcripts is responsible for the observed differences in at least five genes. However, those alternative splicing events do not appear to be differentially regulated among distinct Arabidopsis tissues examined. Lastly, expression of those TF genes in 17 distinct Arabidopsis organ types and the cultured cells was profiled using a 70-mer oligo microarray.


Figures

Figure 1.
Figure 1.
Schematic diagrams showing strategies of high-throughput cloning of blunt-ended PCR amplified TF gene ORFeome products. A, Cloning of ORFeome product into the pENTR-TOPO vector. The PCR products containing individual TF gene ORFs were directionally cloned into pENTR-TOPO vectors using the TOPO DNA recombination reaction facilitated by topoisomerase I attached to one of the vector strands. B, Map of pYTV. This yeast expression vector was modified based on vector pDEST 52 (Invitrogen). The fused tags at the C-terminal of TF ORF include three copies of Flag, six His amino acids, and two copies of IgG-binding motif from protein A. Those tags should enable tandem affinity purification (TAP) of the TF proteins (Rigaut et al., 1999). C, Generation of yeast expression cassette using pENTR clones and pYTV vector. Recombination between different pENTR-TFs and pYTV vectors were carried out in the presence of Gateway LR Clonase enzyme mix. AscI and SacII were designed for determination of the insert size. For further details about this gateway system, please refer to the Invitrogen manual (www.invitrogen.com).
Figure 2.
Figure 2.
Protein-blot analysis of Arabidopsis TF protein expression in Saccharomyces cerevisiae. Total proteins were fractionated by SDS-PAGE, probed with 1 ug/mL monoclonal antipolyhistidine antibody, and visualized after incubating with goat anti-mouse AP-conjugated secondary antibody. * marks the protein that migrated significantly slower than its predicted Mr.
Figure 3.
Figure 3.
Expression profiles of 66 Arabidopsis MADS family TF genes in 17 different Arabidopsis organs and cultured cells. Locus ID is listed at the left of the column, and only those MADS box genes whose ORFeome clones are presented in our collection were analyzed. All comparisons were done against the absolute median point obtained for the respective organ. The ratio value of the normalized signal intensity in each organ for a given gene (see “Materials and Methods”) relative to the median value from that organ was first calculated. Then this ratio was subjected to logarithmic (log2) transformation, with the resulting value as indicator of relative expression level among organ type. Therefore, a value of zero indicates an expression level equal to the median of all gene expression in that organ, a positive value indicates an expression level higher than the media, and a negative value indicates an expression level lower than the median. The 18 lanes are as follows: a, cauline leaf; b, light cotyledon; c, rosette leaf; d, dark cotyledon; e, dark hypocotyls; f, light hypocotyl; g, pistil 1 d after pollination; h, pistil 1 d before pollination; i, Silique 3 d after pollination; j, silique 8 d after pollination; k, stem; l, sepal; m, stamen; n, petal; o, dark root; p, light root; q, germinating seed; and r, cultured cells.
Figure 4.
Figure 4.
Distribution of expression abundance for the 858 TF genes. A, Distribution of TF gene expression levels in cauline leaf. B, Distribution of TF gene levels in stamen. C, Distribution of TF gene levels in light root. D, An averaged distribution of TF gene expression levels in all 17 organs. A similar method was used to calculate relative expression as described in the legend for Figure 3 and the log (2) values for the ratio for the normalized expression levels with the median are shown in the x axis.
Figure 5.
Figure 5.
The relative expression levels of the 6 well-characterized MADS box TF genes in 17 organ types as determined by our microarray analysis. A, AGL1 (At3g58780); B, AGL2 (At5g15800); C, AGL3 (At2g03710); D, AGL8 (At5g60910); E, AGL15 (At5g13790); and F, AGL21 (At4g37940). The observed expression patterns from our microarray studies are consistent with the previously reported results (see Table IV).
Figure 6.
Figure 6.
Summary of TF gene expression characteristics among Arabidopsis organ types. A, The percentage of TF genes expressed in different organs. Abbreviations: DPP, day post pollination; DBP, day before pollination. A total 858 TF genes (see text) are analyzed, and 61% (cauline leaf), 70% (rosette leaf), 58% (stem), 49% (light root), 41% (dark root), 76% (sepal), 76% (petal), 79% (stamem), 71% (pistil 1DBP), 57% (pistil 1DPP), 65% (silique 3DPP), 37% (silique 8DPP), 40% (germinating seed), 58% (light cotyledon), 61% (dark cotyledon), 39% (light hypocotyl), 43% (dark hypocotyl) were detected expression respectively. B, Distribution of TF genes in their highest expression level among 17 different issues. Among the 858 TF genes analyzed, 3% (cauline leaf), 12% (rosette leaf), 8% (stem), 7% (light root), 5% (dark root), 2% (sepal), 5% (petal), 6% (stamem), 7% (pistil 1DBP), 1% (pistil 1DPP), 2% (silique 3DPP), 6% (silique 8DPP), 13% (germinating seed), 6% (light cotyledon), 3% (dark cotyledon), 11% (light hypocotyl), and 3% (dark hypocotyl) are expressed at their highest level in the indicated organ types, respectively.
Figure 7.
Figure 7.
Alternative splicing of five Arabidopsis TF genes. A diagram of the exon/intron structures of the alternative spliced transcripts of At1g72050 (A), At4g26640 (B), At4g29930 (C), At1g26260 (D), and At3g46590 (E) is shown on the left. Sequence-specific primers were synthesized for each form of the mature RNA as outlined on the left side. For each gene, our version of gene structure and PCR product is placed on top, while the gene structure and PCR products based on prior information is placed on bottom. The levels of the two mature RNA molecules from Arabidopsis plant samples were analyzed by RT-PCR, and only one representative result is shown as ethidium bromide-stained DNA band, with the length of full-length ORF marked to the right. At the bottom is a scale that indicates the lengths of introns (represented by thin lines) and exons (thick black boxes) in all the genes compared. The small bar to the lower transcript shown in D designates the position of the forward primer used to amplify the RAFL reported version of cDNA since the 5′ end of these two mature RNA molecules were identical and hence only the 995 bp band represented a partial ORF. However, the PCR primer pair for the 1,173 bp cDNA (based on the full-length ORF of RAFL cDNA) can amplify both the 1,020 bp cDNA band (our new version) and the 1,173 bp cDNA, so that doublet bands were observed.

References

    1. The Arabidopsis Genome Initiative (2000) Analysis of the genome sequence of the flowering plant Arabidopsis thaliana. Nature 408: 796–815 - PubMed
    1. Burgeff C, Liljegren SJ, Tapia-López R, Yanofsky MF, Alvarez-Buylla ER (2002) MADS-box gene expression in lateral primordia, meristems and differentiated tissues of Arabidopsis thaliana roots. Planta 214: 365–372 - PubMed
    1. Chen W, Provart NJ, Glazebrook J, Katagiri F, Chang H-S, Eulgem T, Mauch F, Luan S, Zou G, Whitham SA, et al (2002) Expression profile matrix of Arabidopsis transcription factor genes suggests their putative functions in response to environmental stresses. Plant Cell 14: 559–574 - PMC - PubMed
    1. Dimova DK, Stevaux O, Frolov MV, Dyson NJ (2003) Cell cycle-dependent and cell cycle-independent control of transcription by the Drosophila E2F/RB pathway. Genes Dev 17: 2308–2320 - PMC - PubMed
    1. Flanagan CA, Hu Y, Ma H (1996) Specific expression of the AGL1 MADS-box gene suggests regulatory functions in Arabidopsis gynoecium and ovule development. Plant J 10: 343–353 - PubMed

Publication types

MeSH terms