. 2004 Jun;135(2):783-800.
doi: 10.1104/pp.103.035584.

Specification of the peroxisome targeting signals type 1 and type 2 of plant peroxisomes by bioinformatics analyses

Affiliations

Specification of the peroxisome targeting signals type 1 and type 2 of plant peroxisomes by bioinformatics analyses

Sigrun Reumann. Plant Physiol. 2004 Jun.

Abstract

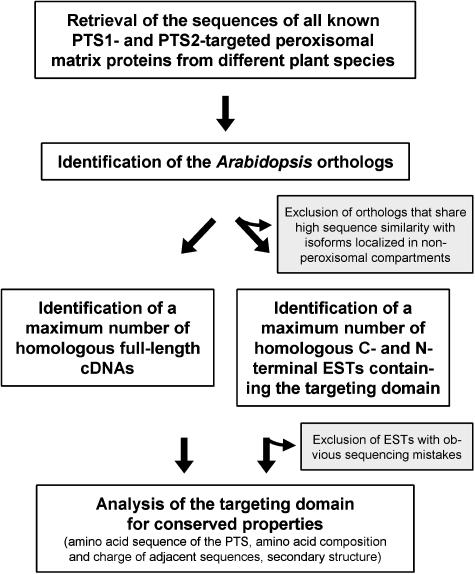
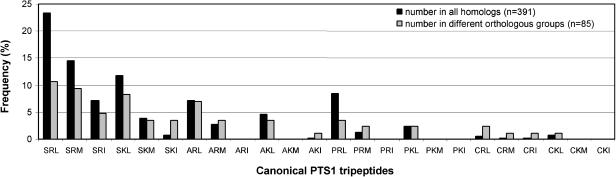
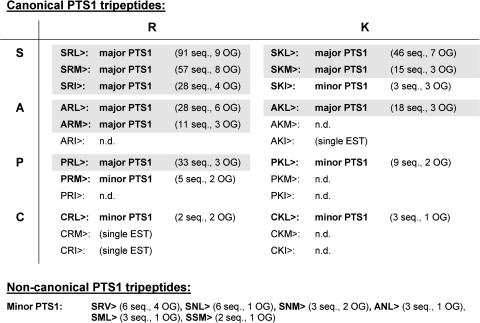
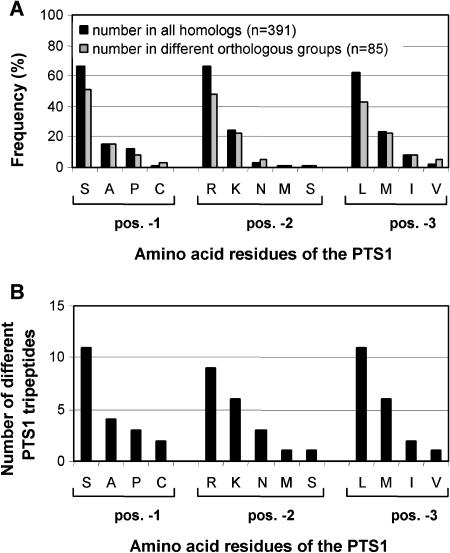
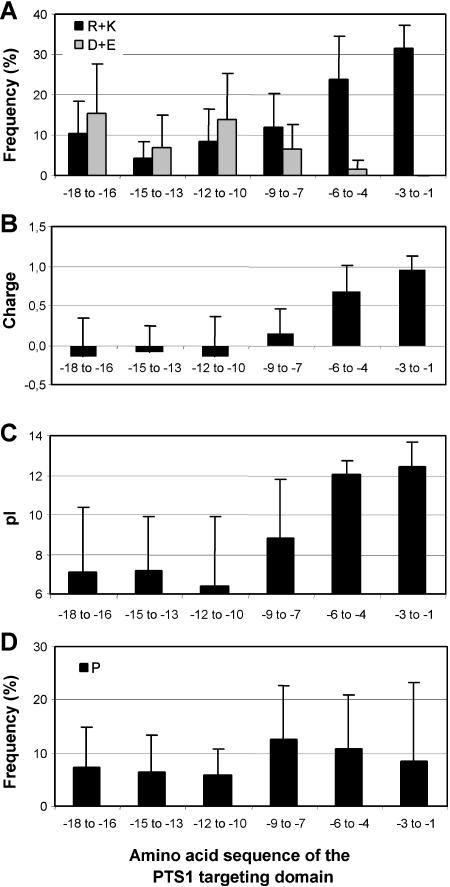
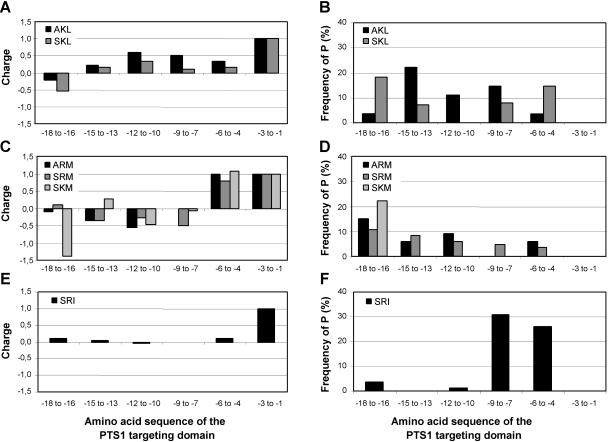
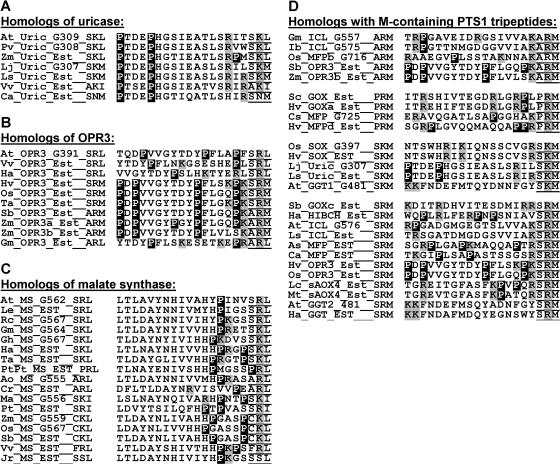
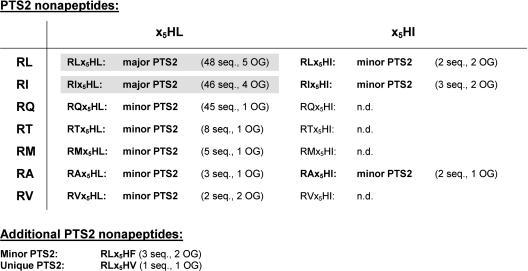
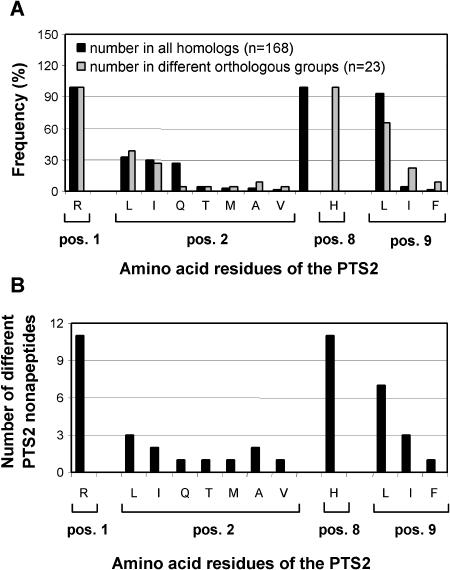
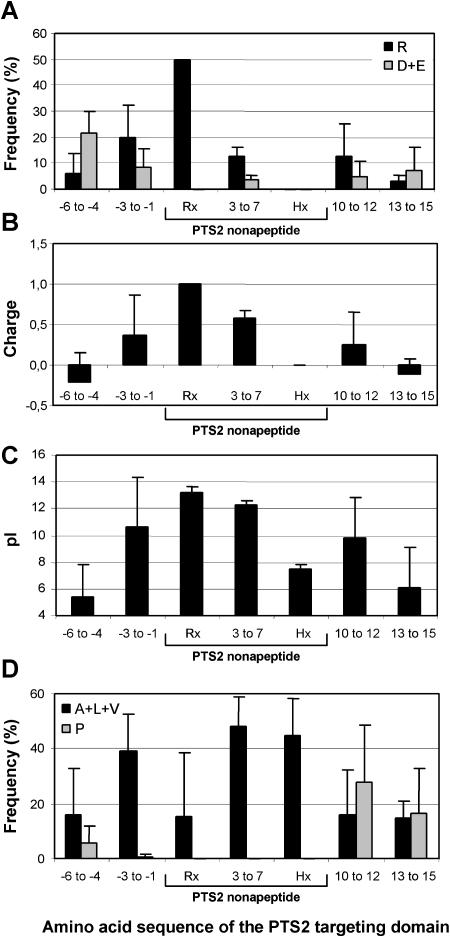
To specify the C-terminal peroxisome targeting signal type 1 (PTS1) and the N-terminal PTS2 for higher plants, a maximum number of plant cDNAs and expressed sequence tags that are homologous to PTS1- and PTS2-targeted plant proteins was retrieved from the public databases and the primary structure of their targeting domains was analyzed for conserved properties. According to their high overall frequency in the homologs and their widespread occurence in different orthologous groups, nine major PTS1 tripeptides ([SA][RK][LM]> without AKM> plus SRI> and PRL>) and two major PTS2 nonapeptides (R[LI]x5HL) were defined that are considered good indicators for peroxisomal localization if present in unknown proteins. A lower but significant number of homologs contained 1 of 11 minor PTS1 tripeptides or of 9 minor PTS2 nonapeptides, many of which have not been identified before in plant peroxisomal proteins. The region adjacent to the PTS peptides was characterized by specific conserved properties as well, such as a pronounced incidence of basic and Pro residues and a high positive net charge, which probably play an auxiliary role in peroxisomal targeting. By contrast, several peptides with assumed peroxisomal targeting properties were not found in any of the 550 homologs and hence play--if at all--only a minor role in peroxisomal targeting. Based on the definition of these major and minor PTS and on the recognition of additional conserved properties, the accuracy of predicting peroxisomal proteins can be raised and plant genomes can be screened for novel proteins of peroxisomes more successfully.


Figures

Figure 1.
Figure 1.
Strategy of the specification of peroxisome targeting signals (PTS) for higher plants by bioinformatics analyses. The genes of peroxisomal matrix proteins that were cloned from Arabidopsis were supplemented by the Arabidopsis orthologs of known PTS1- and PTS2-targeted matrix proteins from other plant species identified by sequence similarity. These proteins were used as query for the identification of a maximum number of homologous full-length cDNA sequences as well as EST sequences containing the targeting domain in the databases by bioinformatics analyses. The peroxisomal targeting domains of all homologs were then analyzed for conserved properties, such as amino acid sequence of the PTS, amino acid composition and charge of adjacent sequences, and secondary structure.
Figure 2.
Figure 2.
Frequency of canonical PTS1 tripeptides in plant homologs of PTS1-targeted proteins. The Arabidopsis orthologs of PTS1-targeted proteins were blasted against the nonredundant protein and against organism-specific EST databases, and a maximum number of homologous sequences were identified from various of higher plants species by sequence similarity (73 full-length cDNAs and 318 C-terminal ESTs). Canonical tripeptides are defined as included in the conservative variant of the plant-specific PTS1 motif ([SAPC][KR][LMI]>; Hayashi et al., 1997). All homologs irrespective of the nature of their C-terminal tripeptide were analyzed (n = 391) or only a single sequence with a specific tripeptide was included per orthologous group (n = 85) to avoid an overestimation of the abundance of specific tripeptides, such as SRI> and PRL>, which are predominantly found in specific orthologous groups (AGT and GOX, respectively). The data for the noncanonical tripeptides are not shown (SRV>, 1.5% in all homologs, 4.7% in different orthologous groups; SNL>, 1.5%/1.2%; SNM>, 0.8%/2.4%; SML>, 0.8%/1.2%; ANL>, 0.8%/1.2%; SSM>, 0.5%/1.2%; unique sequences, AKS>, ALL>, FRL>, FRV>, FYL>, ISR>, IYI>, KAL>, LKR>, LRL>, LWQ>, QFL>, SAM>, SRF>, SSL>, and TEP>). Nine major PTS1 tripeptides ([SA][RK][LM]> without AKM> plus SRI> and PRL>) are considered strong indicators for peroxisomal localization.
Figure 3.
Figure 3.
Definition of major and minor PTS1 tripeptides of peroxisomal proteins from higher plants. Major PTS1 tripeptides are defined as C-terminal peptides present in at least 10 sequences and 3 different orthologous groups. Minor PTS1 tripeptides are present in at least two sequences. Major PTS1 tripeptides are given in bold print and shaded in gray. Minor PTS1 tripeptides are given in bold print. Canonical PTS1 tripeptides are included in the restrictive plant-specific motif determined by Hayashi et al. (1997). OG, orthologous groups; n.d., not detected.
Figure 4.
Figure 4.
Position-specific frequency of amino acids in PTS1 tripeptides (A) and number of different PTS1 tripeptides in which these amino acids are present (B). Highly abundant amino acids of PTS1 tripeptides that are present in about 60% of the sequences are S (position −3), R (position −2), and L (position −1), medium abundant (>20%) K (position −2) and M (position −1), and the remaining low abundant (≤15%; A, P, and C at position −3; N, M, and S at position −2, and I and V at position −1). A, The position-specific frequency of amino acids roughly correlates with the number of different PTS1 peptides in which they are present (B). Sequences with unique C-terminal tripeptides were not considered.
Figure 5.
Figure 5.
Conserved properties of the PTS1 targeting domain. A, Relative content of basic (R + K) and acidic amino acids (D + E). B, Net charge, determined as the number of basic (R + K) minus acidic residues (D + E). C, pI. D, Relative content of P. The homologs of PTS1-targeted proteins were grouped according to their PTS1 tripeptide. Sequences of groups containing less than five sequences were analyzed together but sequences with unique C-terminal tripeptides were excluded. The amino acid composition of the C-terminal 18-mer was analyzed in groups of three amino acids. Apart from an enrichment in basic and P residues, the PTS1 domain is characterized by a low content of S-containing (C, M) and aromatic residues and a high content of hydrophobic residues, especially A and L, as well as hydroxylated amino acids (A + L, 19% in the C-terminal 18 amino acids; S + T, 15% between position −7 and −15; data not shown).
Figure 6.
Figure 6.
Net charge and Pro content of the PTS1 targeting domain of proteins with SKL> or AKL> (A and B), with M-containing PTS1 tripeptides (C and D), and of proteins with SRI> (E and F). The most C-terminal 18 amino acids were analyzed in groups of three amino acids and the charge (A, C, and E) and the relative content of P (B, D, and F) were calculated. In proteins with the tripeptides AKL> and SKL> the positive net charge is less pronounced in the 3-mer preceeding the PTS1 but is spread over a longer peptide from position −4 to −12 (A and B). Proteins with M-containing PTS1 have an unusually low P content directly in front of the PTS1 tripeptide (position −4 to −9) but possess a high P content further upstream of the PTS1 tripeptide (position −10 to −18) and a pronounced positive net charge in front of the PTS1 (C and D). The proteins with the tripeptide SRI>, which are predominantly AGT homologs, do not carry a positive net charge in the targeting domain except for the R of the PTS1 tripeptide itself but possess about two P residues directly in front of the PTS1 (E and F).
Figure 7.
Figure 7.
Sequence comparison of the PTS1 targeting domain of homologs from uricase (uric; A), 12-oxophytodienoate reductase (OPR3; B), and malate synthase (MS; C), and proteins with M at position −1 of the PTS1 tripeptide (D). Basic residues are shaded in gray and P residues in black. Most uric homologs with the PTS1 tripeptide SKL> (8 out of 9; 3 homologs shown) lack another basic residue at position −4, whereas 4 homologs (out of 11; 2 homologs shown) with SKM> and the 2 homologs with weaker PTS1 tripeptides (AKI> and SNM>) contain an additional basic residue at position −4 (A). Similarly, none of the 7 homologs of ORP3 with the PTS1 SRL> carry a second basic residue at position −4 (only one at position 5; 3 homologs shown), whereas all 6 homologs with SRM> or ARM> and the homolog with ARL> possess a second basic residue at position −4 (B). In addition to the conserved P at position −7/−8, all 10 MS homologs with SRL> (3 homologs shown), most homologs with SKL> (5 out of 8; 4 homologs shown), and the homolog with PRL> lack a second P at position −4. By contrast, all 3 homologs with CKL> as well as the 2 homologs with SKI> and FRL> contain an additional P at position −4 or −5 (C). Regarding those proteins with M at position −1 of the PTS1 tripeptide (S[RK]M>, [AP]RM>), the large majority contains a second basic residue in front of the PTS1 (position −4 to −6) with a strong preference for position −4, even though the proteins are derived from 9 different orthologous groups in many of which the second basic residue is not conserved (ARM>, all 11 with R/K at position −4; PRM>, all 5 with R/K at position −4 to −6; SKM>, 13 out of 15 with R/K at position −4 to −6; SRM>, 38 out of 57 with R/K at position −4) (D). The homologs of GGT (e.g. 15 GGT homologs with SRM>) represent an exception in that most of them do not carry a second basic residue or P in front of the PTS1. Per group of PTS1 tripeptide (S[RK]M>, [AP]RM>) 2 sequences are shown at maximum for each orthologous group. Ao, Asparagus officinalis; As, Aegilops speltoides; At, Arabidopsis; Ca, Capsicum annuum; Cr, Ceratopteris richardi; Cs, Cucumis sativus; Gm, Glycine max; Gh, Gossypium hirsutum; Ha, Helianthus annuus; Hv, Hordeum vulgare; Ib, Ipomoea batatas; Jr, Juglans regia; Lc, Lotus corniculatus var japonicus; Le, Lycopersicon esculentum; Lj, Lotus japonicus; Ls, Lactuca sativa; Ma, Musa acuminate; Mt, Medicago truncatula; Os, Oryza sativa; Pt, Pinus taeda; Pv, Phaseolus vulgaris; Rc, Ricinus communis; Sb, Sorghum bicolor; Sc, Secale cereale; Ta, Triticum aestivum; Vv, Vitis vinifera; Zm, Zea mays.
Figure 8.
Figure 8.
Definition of major and minor PTS2 nonapeptides of peroxisomal proteins from higher plants. Major PTS2 nonapeptides are defined as N-terminal peptides present in at least 10 sequences and 3 different orthologous groups. Minor PTS2 nonapeptides are present in at least two sequences. Major PTS2 nonapeptides are printed in bold and shaded in gray. Minor PTS2 nonapeptides are printed in bold. OG, orthologous groups; n.d., not detected.
Figure 9.
Figure 9.
Position-specific frequency of amino acids in PTS2 nonapeptides (A) and number of different PTS2 nonapeptides in which these amino acids are present (B). The position-specific frequency of amino acids roughly correlates with the number of different PTS2 peptides in which they are present. One sequence with a unique nonapeptide was not considered.
Figure 10.
Figure 10.
Conserved properties of the PTS2 targeting domain. A, Relative content of R and acidic residues (D + E). B, Net charge, determined as the number of basic minus acidic residues. C, pI. D, Relative content of hydrophobic residues (L + A + V) and P residues. The homologs of PTS2-targeted proteins were grouped according to their PTS2 nonapeptide and analyzed. Sequences of groups containing less than five sequences were analyzed together but the sequence with a unique nonapeptide was excluded. The amino acid composition of PTS2 proteins was analyzed in groups of two to five amino acids. The PTS2 targeting domain was defined as a region of approximately 15 residues surrounding roughly symmetrically the PTS2 nonapeptide (position −3 to 12). The content of K as well as G and I were significantly lower as compared to that of R and L, A, and V, respectively (data not shown). Apart from these characteristics, the PTS2 domain was characterized by a low content of S-containing (C, M) and aromatic residues (data not shown).

Similar articles

Cited by

References

    1. Amery L, Brees C, Baes M, Setoyama C, Miura R, Mannaerts GP, Van Veldhoven PP (1998) C-terminal tripeptide Ser-Asn-Leu (SNL) of human D-aspartate oxidase is a functional peroxisome-targeting signal. Biochem J 336: 367–371 - PMC - PubMed
    1. Arabidopsis Genome Initiative (2000) Analysis of the genome sequence of the flowering plant Arabidopsis thaliana. Nature 408: 796–815 - PubMed
    1. Cutler SR, Ehrhardt DW, Griffitts JS, Somerville CR (2000) Random GFP::cDNA fusions enable visualization of subcellular structures in cells of Arabidopsis at a high frequency. Proc Natl Acad Sci USA 97: 3718–3723 - PMC - PubMed
    1. Dammai V, Subramani S (2001) The human peroxisomal targeting signal receptor, Pex5p, is translocated into the peroxisomal matrix and recycled to the cytosol. Cell 105: 187–196 - PubMed
    1. de Hoop MJ, Ab G (1992) Import of proteins into peroxisomes and other microbodies. Biochem J 286: 657–669 - PMC - PubMed

Publication types

MeSH terms

Substances

LinkOut - more resources