. 2004 Jul;10(7):1153-61.
doi: 10.1261/rna.5250604.

Quantitation of microRNAs using a modified Invader assay

Affiliations

Quantitation of microRNAs using a modified Invader assay

Hatim T Allawi et al. RNA. 2004 Jul.

Abstract

The short lengths of microRNAs (miRNAs) present a significant challenge for detection and quantitation using conventional methods for RNA analysis. To address this problem, we developed a quantitative, sensitive, and rapid miRNA assay based on our previously described messenger RNA Invader assay. This assay was used successfully in the analysis of several miRNAs, using as little as 50-100 ng of total cellular RNA or as few as 1,000 lysed cells. Its specificity allowed for discrimination between miRNAs differing by a single nucleotide, and between precursor and mature miRNAs. The Invader miRNA assay, which can be performed in unfractionated detergent lysates, uses fluorescence detection in microtiter plates and requires only 2-3 h incubation time, allowing for parallel analysis of multiple samples in high-throughput screening analyses.


Figures

FIGURE 1.
FIGURE 1.
Schematic representation of the Invader miRNA assay. (A) Primary reaction of the Invader mRNA assay: Annealing of the invasive and probe oligonucleotides to an RNA target forms an overlap-flap structure that is a substrate for the structure-specific 5′ nuclease, Cleavase. The mRNA target is shown in gray and the target-specific oligonucleotides are shown in black. The noncomplementary 5′ flap of the probe oligonucleotide is hatched, and the arrow indicates the site of cleavage, which releases the 5′ flap. (B) Secondary reaction to generate quantifiable signals: A secondary overlap-flap structure is formed by hybridizing both the 5′ flap that had been released in the primary reaction and a FRET oligonucleotide to a secondary reaction template (SRT). The FRET oligonucleotide is labeled with a fluorophore (F) and a quencher (Q) so cleavage between them generates a fluorescence signal. A 2′-O-methyl arrestor oligonucleotide (double lines) complementary to the probe is added to the secondary reaction, to sequester the uncleaved probes so they cannot bind to the SRT. (C) Invader miRNA assay primary reaction: The overall structure of the substrate resembles that shown in A, except that the short size of the miRNA target requires the inclusion of extra structures derived from the invasive and probe oligonucleotides, forming a dumbbell-like structure. The miRNA target is shown in gray, the target-specific oligonucleotide sequences in black, and the stem–loop hairpin regions of the invasive and probe oligonucleotides, which contain 2′-O-methyl nucleotides, are shown by double lines. The noncomplementary 5′-flap is hatched and the arrow indicates the site of cleavage, which releases the 5′ flap.
FIGURE 2.
FIGURE 2.
(A) Invasive and probe oligonucleotides designed to detect let-7a RNA, and nucleotide sequences of let-7a RNA and closely related let-7 variants (shown in italics); nucleotide differences from let-7a RNA are in lowercase or a dash. 2′-O-methyl containing nucleotides of the regions forming hairpin structures are in bold. (B) Dose response of the net fluorescence signal generated in the Invader assay using synthetic let-7a RNA. (C) Temperature dependence of the fluorescence signals generated in the Invader miRNA assay using as targets the let-7 variants indicated in A. (D) Invasive and probe oligonucleotides designed to detect let-7c RNA, and nucleotide sequences of let-7 variants highlighted (in lowercase or by a dash) where the sequence differs from let-7c. (E) Temperature dependence of the fluorescence signals generated in the Invader let-7c assay using as targets the let-7 variants indicated in D. let-7a, let-7e, and let-7f variants generated very low net signal and their temperature-dependence curves are superimposed in the figure.
FIGURE 3.
FIGURE 3.
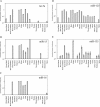
Expression profiles for let-7a (A), miR-15 (B), miR-16 (C), miR-125b (D) and miR-135 (E) in 50–100 ng of total RNA from a variety of human tissues. Relative miRNA levels were quantitated using the fluorescence signals generated by the appropriate Invader miRNA assay, adjusted for the amount (in nanograms) of total RNA in each sample. For comparison between samples, these numbers were then normalized to the signal obtained for miRNA in whole brain.
FIGURE 4.
FIGURE 4.
Quantities of let-7a and miR-16 RNAs per HeLa cell. Total RNA was isolated from HeLa cells and analyzed either by the Invader let-7a assay or by quantitative Northern blotting. We used 50 ng of RNA in the Invader reaction and the fluorescence signal generated was compared to a standard curve generated using known amounts of synthetic let-7a RNA, to determine attomoles of miRNA per nanogram of HeLa cell RNA. These numbers were converted to molecules per cell, assuming 35 pg RNA per HeLa cell. Standard errors are from the standard curve and three independent measurements. Similarly, the numbers of molecules per cell were calculated when the cells were lysed with NP-40, without RNA isolation. In this case, a total of 4500 cells (counted prior to harvesting) were used in each assay. The Northern blots were performed on 2 or 10 μg of the same HeLa cell RNA preparation used in the Invader assay, with standards of 2.5, 0.50, or 0.25 fmoles of synthetic let-7a RNA and 4.4, 0.44, or 0.22 fmoles of synthetic miR-16 RNA run on adjacent lanes to generate a standard curve (Lim et al. 2003). The blot was probed with 32P-UTP-labeled T7 transcribed RNAs complementary to let-7a or miR-16 RNAs, and signals were quantified on a phosphorimager and were normalized to a standard curve to yield molecules per cell. Standard errors for let-7a Northern blots are the standard deviations of duplicate experiments. A single Northern blot experiment was performed for miR-16; thus no standard errors are reported. The amounts of RNA used as standards were calculated assuming extinction coefficients of 2.38 and 2.26 × 10⁵ L/mole • cm for let-7a and miR-16 RNAs, respectively.
FIGURE 5.
FIGURE 5.
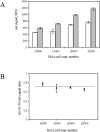
Uniform detection of let-7a RNA in HeLa cell lysates, biplexed with a U6 RNA Invader assay for normalization. (A) Net signals for let-7a RNA (open bars) and U6 RNA (gray bars) were measured by a biplex Invader assay of NP-40 performed on lysates of different numbers of HeLa cells. The signals detected for the miRNA and the U6 RNA were from spectrally distinct FAM and Redmond Red fluorophores, respectively. (B) The let-7a net signal values were divided by the corresponding U6 RNA signal values to obtain a normalized signal. The average of the four normalized let-7a values is shown by the dashed line.

References

    1. Banerjee, D. and Slack, F. 2002. Control of developmental timing by small temporal RNAs: A paradigm for RNA-mediated regulation of gene expression. Bioessays 24: 119–129. - PubMed
    1. Bartel, D.P. 2004. MicroRNAs: Genomics, biogenesis, mechanism, and function. Cell 116: 281–297. - PubMed
    1. Bevington, P.R. 1969. Propagation of errors. In Data reduction and error analysis for the physical sciences, pp. 56–60. McGraw-Hill Book Company, New York.
    1. Cantor, C.R., Warshaw, M.M., and Shapiro, H. 1970. Oligonucleotide interactions. III. Circular dichroism studies of the conformation of deoxyoligonucleotides. Biopolymers 9: 1059–1077. - PubMed
    1. Carmell, M.A., Xuan, Z., Zhang, M.Q., and Hannon, G.J. 2002. The Argonaute family: Tentacles that reach into RNAi, developmental control, stem cell maintenance, and tumorigenesis. Genes & Dev. 16: 2733–2742. - PubMed

Publication types

LinkOut - more resources