. 2004 Jun;2(6):e152.
doi: 10.1371/journal.pbio.0020152. Epub 2004 Jun 15.

Plasticity of DNA replication initiation in Epstein-Barr virus episomes

Affiliations

Plasticity of DNA replication initiation in Epstein-Barr virus episomes

Paolo Norio et al. PLoS Biol. 2004 Jun.

Abstract

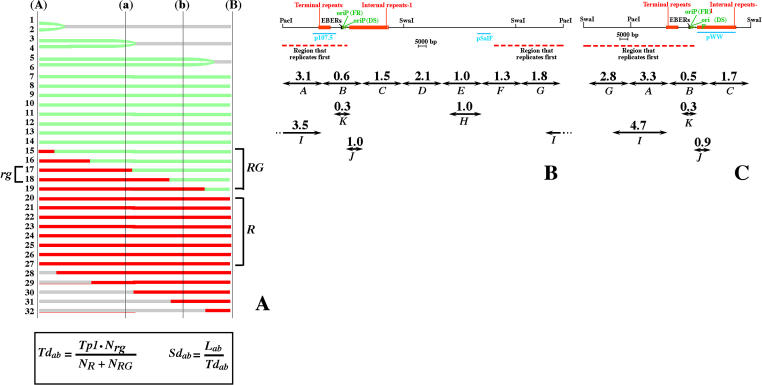
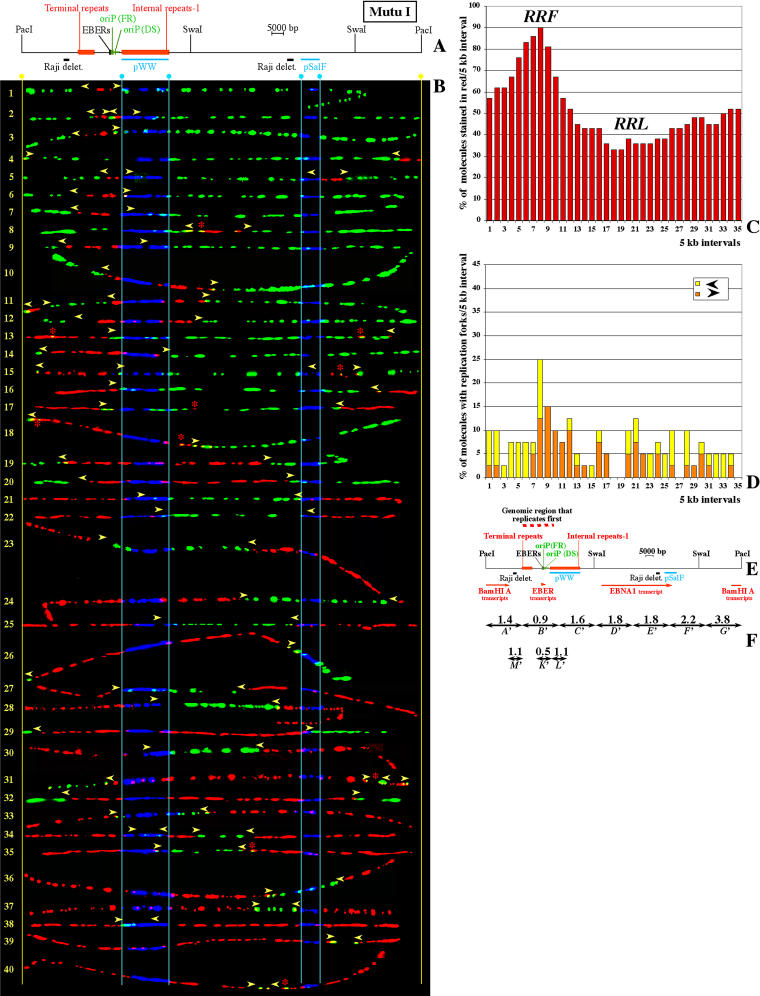
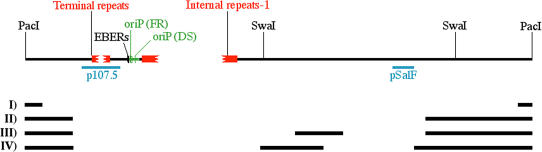
In mammalian cells, the activity of the sites of initiation of DNA replication appears to be influenced epigenetically, but this regulation is not fully understood. Most studies of DNA replication have focused on the activity of individual initiation sites, making it difficult to evaluate the impact of changes in initiation activity on the replication of entire genomic loci. Here, we used single molecule analysis of replicated DNA (SMARD) to study the latent duplication of Epstein-Barr virus (EBV) episomes in human cell lines. We found that initiation sites are present throughout the EBV genome and that their utilization is not conserved in different EBV strains. In addition, SMARD shows that modifications in the utilization of multiple initiation sites occur across large genomic regions (tens of kilobases in size). These observations indicate that individual initiation sites play a limited role in determining the replication dynamics of the EBV genome. Long-range mechanisms and the genomic context appear to play much more important roles, affecting the frequency of utilization and the order of activation of multiple initiation sites. Finally, these results confirm that initiation sites are extremely redundant elements of the EBV genome. We propose that these conclusions also apply to mammalian chromosomes.


Conflict of interest statement

The authors have declared that no conflicts of interest exist.

Figures

Figure 1
Figure 1. Fluorescent Hybridization Immunostaining of Individual EBV Episomes
Image of two stretched DNA molecules in the same optical field. The hybridization signals (p107.5 and pSalF) and the immunostaining to detect the halogenated nucleotides are shown in different pseudocolors (red = IdU, green = CldU, and blue = hybridization probes). The top panel shows the merged image. The different color channels are shown separately in the lower panels. One of the two stretched molecules is a PacI-linearized EBV episome (molecule above) and can be recognized by the presence of the hybridization signals. The molecule below is a piece of cellular genomic DNA of similar size (no hybridization signals). The presence of the hybridization signals decreases the intensity of the immunostaining along the same portion of the EBV episome. This confirms that both halogenated nucleotides and hybridization probes are located on the same DNA molecule. The blue dots visible in the bottom panel represent hybridization background (this background was digitally removed from Figures 3B, 4B, and 6B). The EBV episome is substituted along its entire length with both IdU (red regions) and CldU (green regions). Yellow arrowheads indicate the approximate position of the replication forks at the time of the switch from the first to the second labeling period. The background visible in the red and green channels is mainly other DNA molecules containing halogenated nucleotides (white horizontal arrowheads). Some of these molecules attached to the glass before becoming fully extended and appear thick, displaying a brighter immunostaining. Small dots are also visible (magenta vertical arrowheads), sometimes overlapping with the DNA molecules (white asterisks); however, they were not considered in our analysis because they are too short to be unequivocally ascribed to DNA replication.
Figure 2
Figure 2. Stretching DNA Molecules by Capillary Action
(A) Lengths of 219 unbroken Raji EBV episomes with a recognizable hybridization pattern. These molecules were stretched by the movement of a DNA solution between a silanized microscope slide and a nonsilanized coverslip. About 94% of these molecules have a size of 70 μm (±15 μm), corresponding to about 2.4 kb/μm. (B) Schematic of the PacI-linearized Raji EBV genome with the positions of various genetic elements shown to scale. The initiation site oriP is shown in green with the FR element and the DS element indicated by green boxes. The positions of EBER genes (black box), terminal repeats (smaller red box), internal repeats 1 (larger red box), and the restriction sites utilized in this study (PacI and SwaI) are also indicated. (C) Images of 6 PacI-linearized Raji EBV episomes aligned with the EBV map after hybridization and immunostaining of the DNA molecules and digital adjustment of length. The hybridization signals are shown in blue. Immunostaining to detect the halogenated nucleotides is shown by red and green. Vertical light blue lines indicate the positions of the ends of the hybridization probes and yellow lines, the position of the PacI site used to linearize the EBV episomes. All the molecules shown in this figure represent EBV episomes duplicated during either the first labeling period (red) or the second labeling period (green). The quality of the alignment of the images with the EBV map is comparable to the alignment previously obtained with combed EBV episomes (Norio and Schildkraut 2001). The resolution of analysis is limited to about 5 kb primarily because of discontinuities in the fluorescent signals, as previously reported for similar assays (Parra and Windle 1993; Jackson and Pombo 1998; van de Rijke et al. 2000).
Figure 3
Figure 3. SMARD Performed on PacI-Linearized EBV Episomes Replicated in Raji Cells
(A) Map of the PacI-linearized EBV genome with the positions of various genetic elements shown to scale. Below the EBV map, light blue bars indicate the positions of the hybridization probes (p107.5 and pSalF) utilized during SMARD to identify the molecules of interest and their orientation. Gray bars (a–h), and black bars (1–10), indicate the positions of the restriction fragments analyzed by 2D gel electrophoresis. (B) PacI-linearized Raji EBV episomes after hybridization and immunostaining of the DNA molecules (aligned with the map). These molecules incorporated both halogenated nucleotides, and the images are ordered (from 1 to 48) by increasing content of DNA labeled during the first labeling period (red). One additional molecule was unsuitable for precise measurements and is not shown. Vertical light blue lines indicate the positions of the ends of the hybridization probes and yellow lines, the position of the PacI site. Arrowheads mark the approximate position of the red-to-green transitions. Asterisks indicate the position of short colored patches not necessarily related to DNA replication. (C) Replication profile of the Raji EBV episomes. This profile was obtained using both the images shown in (B) and the images collected in a previous SMARD experiment (Norio and Schildkraut 2001), for a total of 69 episomes. Starting from the PacI site, genomic intervals of 5 kb are indicated on the horizontal axis by numbers from 1 to 35. The vertical axis indicates the percentage of molecules stained red within each 5-kb interval. (D) Profile of replication fork abundance and direction throughout the EBV genome. Genomic intervals of 5 kb are indicated on the horizontal axis as for (C). The vertical axis indicates the percentage of molecules (out of a population of 69 episomes) containing replication forks (red-to-green transitions) within each 5-kb interval. The forks moving from left to right are depicted in orange. The forks moving from right to left are depicted in yellow. (E) Map of the EBV genome aligned with the horizontal axes of histograms (C) and (D), and with the restriction fragments analyzed by 2D gel electrophoresis (black and gray bars below the map). Green Is indicate the presence of replication bubbles. Red Ts indicate the presence of replication intermediates produced by random termination events. Replication bubbles were detected by 2D gel electrophoresis across the region marked by the red dashed line (approximately corresponding to the RRF). (F) Transcription of the Raji EBV genome. Red arrows mark the positions of regions that can be transcribed during latency. The level of transcription derived by nuclear run-on according to Kirchner et al. (1991) is shown as gray scale (black = highest level; white = lowest level or not transcribed). The EBER genes represent the most intensively transcribed portion of the EBV genome. Intermediate levels of transcription were detected across and downstream from the long transcription unit of the EBNA genes. According to Sample and Kieff (1990), the level of transcription along the EBNA genes region decreases from left to right (I–III). Intermediate levels of transcription were also reported for the two hatched regions. However, these regions contain either repeated sequences (the terminal repeats) or cross-hybridize with other transcribed regions (oriLytR and oriLytL); therefore, their actual level of transcription could be lower.
Figure 4
Figure 4. SMARD Performed on SwaI-Digested EBV Episomes Replicated in Raji Cells
(A) Map of the approximately 105-kb fragment obtained by digesting EBV episomes with the restriction endonuclease SwaI. (B) Images of 36 EBV molecules ordered and marked as in Figure 3B. Molecules 18 and 19 are distorted, but the positions of the red-to-green transitions are clear. (C) Replication profile of the SwaI-digested EBV episomes shown in (B). Starting from the SwaI site, intervals of 5 kb are indicated on the horizontal axis by numbers from 1 to 21. The vertical axis indicates the percentage of molecules stained red within each 5-kb interval. (D) Profile of replication fork abundance and direction. Intervals of 5 kb are indicated on the horizontal axis as for (C). The vertical axis indicates the percentage of molecules containing replication forks in each 5-kb interval. The partitioning of the EBV genome is different from Figure 3D. Hence, the four pausing sites that in Figure 3D were located within interval 8 are here located between interval 13 and interval 14. As a consequence, the peak visible in Figure 3D is here split into two smaller adjacent peaks. (E) Map of the approximately 105-kb SwaI fragment aligned with the horizontal axes of histograms (C) and (D).
Figure 5
Figure 5. Duplication Speed of Various Segments of the Raji EBV Genome
(A) A detailed procedure to calculate Td using SMARD was published elsewhere (Norio and Schildkraut 2001). Here we describe how to calculate Tdab for a generic genomic region (a)–(b) (i.e., any portion of the EBV genome) using information derived from the replication patterns of a longer region (A)–(B) (i.e., the whole EBV genome). Depicted are the hypothetical staining patterns for 32 DNA molecules representing the genomic region (A)–(B) after double-labeling with two halogenated nucleotides (red and green). The molecules that started and completed their duplication during the first labeling period are fully red (R). The molecules that started their duplication during the first labeling period, completing it during the second labeling period are stained in both red and green (RG). In the total population of molecules, the fraction of R molecules increases when the length of the first labeling period (Tp1) increases. The fraction of RG molecules is proportional to the time required to duplicate the genomic region (A)–(B). Some of these molecules (marked rg) are stained in red and green also within the region (a)–(b). The fraction of rg molecules is proportional to the time required to duplicate the genomic region (a)–(b). This relationship is expressed by the equation reported at the bottom of the figure and allows us to calculate Tdab using parameters that can be easily measured on individual DNA molecules (NR, the number of R molecules; NRG, the number of RG molecules; Nrg, the number of rg molecules). Finally, the ratio between the size of the genomic segments analyzed (Lab) and Tdab represents the duplication speed of the segment (Sdab). The results obtained from the PacI and the SwaI experiments are reported in (B) and (C). Double-headed arrows indicate the genomic segments analyzed quantitatively. Segments marked with the same letter in the two maps correspond to identical portions of the Raji EBV genome. Above each arrow is indicated the corresponding Sd value in kilobases per minute. The sizes of these segments are as follows: A–G, 25 kb; H, 20 kb; I, 35 kb; K, 10 kb; L, 75 kb; and J, 10 kb. A comparison of the values obtained from the two experiments shows remarkable similarities. The largest variation was found for segment G. However, in both experiments this segment was located at the end of the DNA molecules. Therefore, the variability in stretching in this portion of the molecules may have affected the collection of the data. The red dashed line below the map indicates the position of the RRF.
Figure 6
Figure 6. SMARD Performed on PacI-Linearized EBV Episomes Replicated in Mutu I Cells
(A) Map of the PacI-linearized EBV genome with the positions of various genetic elements shown to scale. Below the EBV map, light blue bars show the positions of the hybridization probes (pWW and pSalF) utilized to identify the EBV molecules and their orientation. Black bars indicate the positions of two short deletions present in the Raji EBV genome (Polack et al. 1984). (B) Images of 40 PacI-linearized EBV episomes ordered and marked as in Figure 3B (from a population of 42 molecules collected in this experiment). Some molecules are distorted but the positions of the red-to-green transitions are clear. Two additional molecules were unsuitable for precise measurements and are not shown. (C) Replication profile of the PacI-linearized EBV episomes shown in (B). Starting from the PacI site, intervals of 5 kb are indicated on the horizontal axis by numbers from 1 to 35. The vertical axis indicates the percentage of molecules stained red within each 5-kb interval. (D) Profile of replication fork abundance and direction. Intervals of 5 kb are indicated on the horizontal axis as for (C). The vertical axis indicates the percentage of molecules containing replication forks in each 5-kb interval. Three different pausing sites contribute to the significant accumulation of replication forks within interval 8 (the two EBER genes and the FR element). A fourth pausing site (the DS element) is located within interval 9, producing a minor accumulation of replication forks. (E) Map of the EBV genome (to scale) aligned with the horizontal axes of histograms (C) and (D). Red arrows mark the positions of regions transcribed during the type I latency that characterize the Mutu I EBV episomes. The red dashed line above the map indicates the position of the RRF. (F) Duplication speed for various segments of the Mutu I EBV genome. Double-headed arrows indicate the genomic segments analyzed quantitatively. Above each arrow is indicated the corresponding Sd value in kilobases per minute. Segments A′–G′ divide the whole EBV genome into seven parts of identical size, corresponding, respectively, to the intervals 1–5, 6–10, 11–15, 16–20, 21–25, 26–30, and 31–35 on the horizontal axes of Figures 3C and 4C. The sizes of these segments are as follows: A′–G′, 25 kb; and K′, L′, and M′, 10 kb. Due to the presence of small differences in the DNA sequence (see text), segments A′–G′ are similar but not identical to segments A–G in Figure 5.
Figure 7
Figure 7. EBV Strains Carrying Large Deletions
Map of a generic EBV genome linearized with the restriction endonuclease PacI. The number of terminal and internal repeats 1 can vary in different EBV strains; therefore, broken lines were inserted in the map at these positions. The deletions present in four EBV strains are shown as black bars below the map. Deletion I is 12 kb in size and is present in episomes of cell lines obtained by transformation with B95–8 EBV isolates (Raab-Traub et al. 1980; Parker et al. 1990). This deletion encompasses a portion of the EBV genome corresponding to the central portion of the Raji RRF. The remaining deletions were artificially engineered in the EBV genome. Deletion II is described in Robertson et al. (1994). Deletion III is described in Robertson and Kieff (1995). Deletion IV is described in both Kempkes et al. (1995a) and Kempkes et al. (1995b).

Similar articles

Cited by

References

    1. Anglana M, Apiou F, Bensimon A, Debatisse M. Dynamics of DNA replication in mammalian somatic cells: Nucleotide pool modulates origin choice and interorigin spacing. Cell. 2003;114:385–394. - PubMed
    1. Aston C, Hiort C, Schwartz DC. Optical mapping: An approach for fine mapping. Method Enzymol. 1999;303:55–73. - PubMed
    1. Babcock GJ, Hochberg D, Thorley-Lawson DA. The expression pattern of Epstein-Barr virus latent genes in vivo is dependent upon the differentiation stage of the infected B cell. Immunity. 2000;13:497–506. - PubMed
    1. Bensimon A, Simon A, Chiffaudel A, Croquette V, Heslot F, et al. Alignment and sensitive detection of DNA by a moving interface. Science. 1994;265:2096–2098. - PubMed
    1. Berezney R, Dubey DD, Huberman JA. Heterogeneity of eukaryotic replicons, replicon clusters, and replication foci. Chromosoma. 2000;108:471–484. - PubMed

Publication types