. 2004 Jun 21;165(6):835-42.
doi: 10.1083/jcb.200312031.

Apaf-1 and caspase-9 accelerate apoptosis, but do not determine whether factor-deprived or drug-treated cells die

Affiliations

Apaf-1 and caspase-9 accelerate apoptosis, but do not determine whether factor-deprived or drug-treated cells die

Paul G Ekert et al. J Cell Biol. .

Abstract

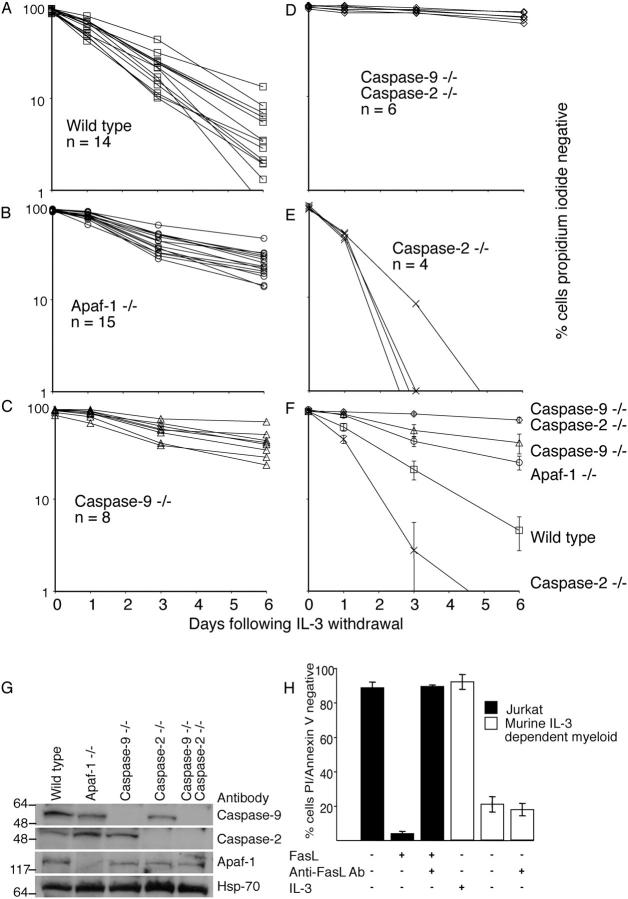
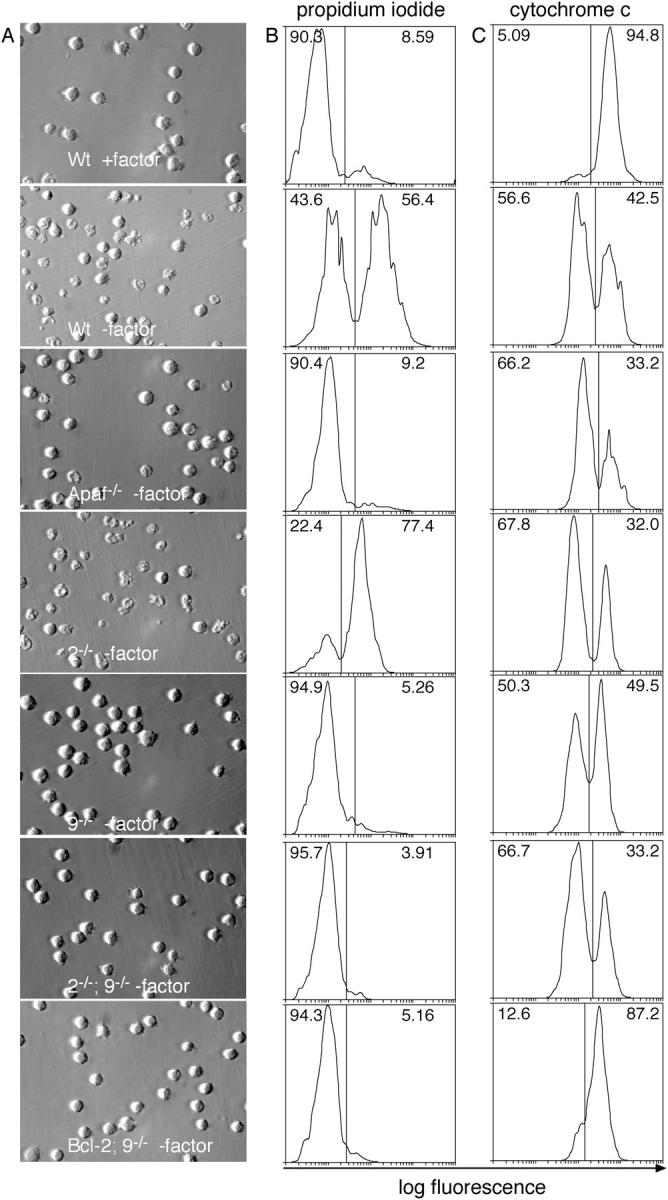
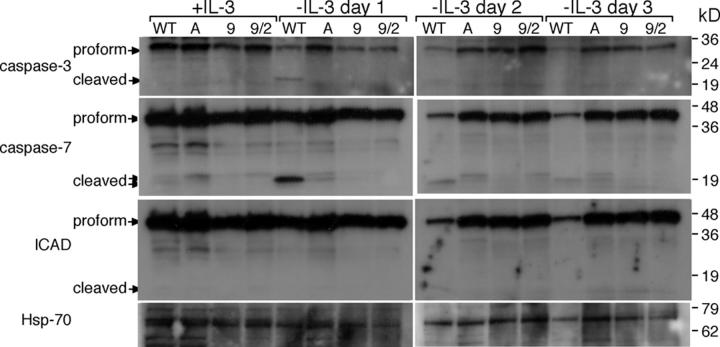
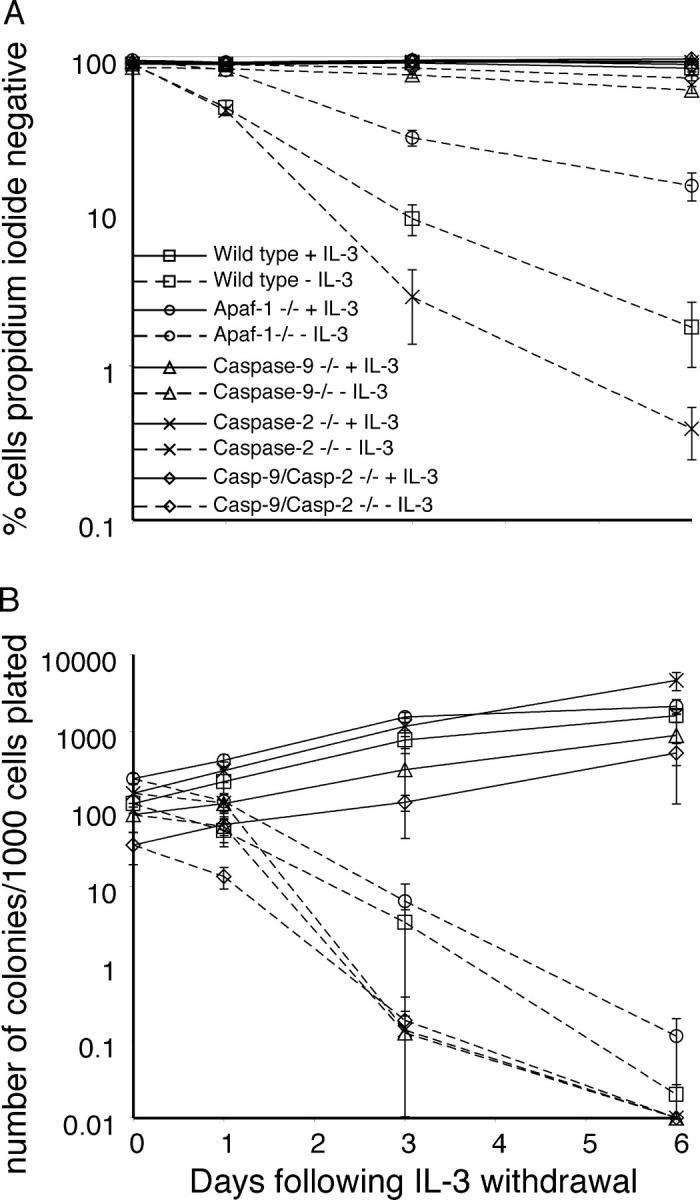
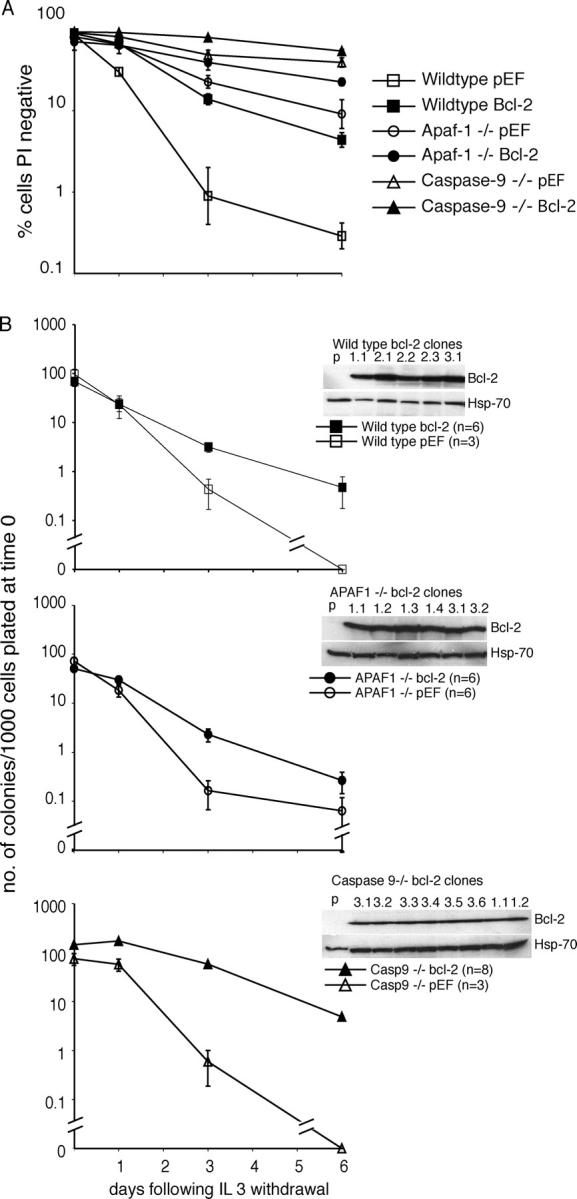
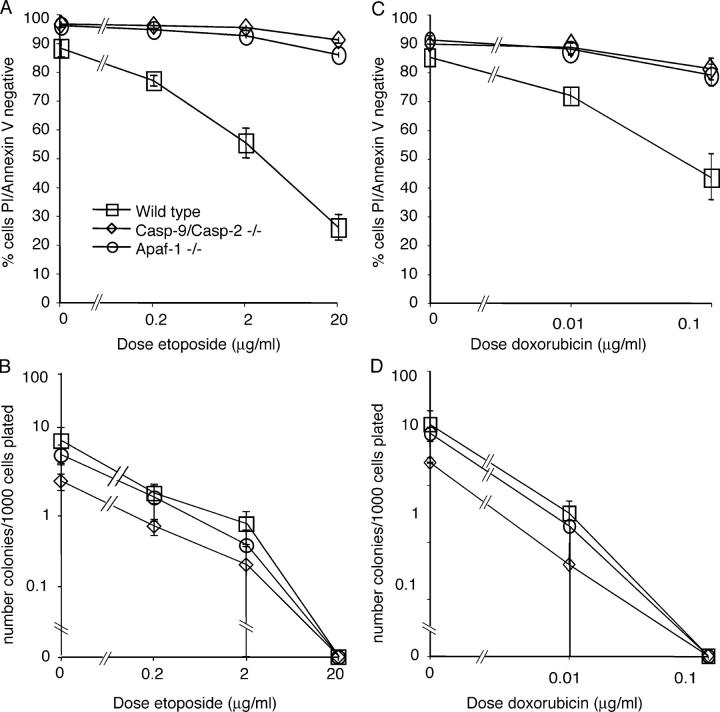
Apoptosis after growth factor withdrawal or drug treatment is associated with mitochondrial cytochrome c release and activation of Apaf-1 and caspase-9. To determine whether loss of Apaf-1, caspase-2, and caspase-9 prevented death of factor-starved cells, allowing them to proliferate when growth factor was returned, we generated IL-3-dependent myeloid lines from gene-deleted mice. Long after growth factor removal, cells lacking Apaf-1, caspase-9 or both caspase-9 and caspase-2 appeared healthy, retained intact plasma membranes, and did not expose phosphatidylserine. However, release of cytochrome c still occurred, and they failed to form clones when IL-3 was restored. Cells lacking caspase-2 alone had no survival advantage. Therefore, Apaf-1, caspase-2, and caspase-9 are not required for programmed cell death of factor-dependent cells, but merely affect its rate. In contrast, transfection with Bcl-2 provided long-term, clonogenic protection, and could act independently of the apoptosome. Unlike expression of Bcl-2, loss of Apaf-1, caspase-2, or caspase-9 would therefore be unlikely to enhance the survival of cancer cells.


Figures

Figure 1.
Figure 1.
Deficiency of Apaf-1, caspase-9, or both caspase-9 and caspase-2 provides short-term protection against IL-3 withdrawal. Multiple independent clones of wild-type (A), Apaf-1 / (B), caspase-9 / (C), caspase-2 / (E), or caspase-9 / ; caspase-2 / (D) IL-3–dependent cell lines were cultured in the absence of IL-3 and viability determined at the indicated times by propidium iodide (PI) exclusion using flow cytometry. The values represent the means of n independent clones in two to three independent experiments. (F) The pooled arithmetic means ± 2 SEM of clones of each genotype is shown. (G) Western blot of representative clones of each of wild-type, Apaf-1 /, and caspase-9 /, caspase-2 /, and caspase-9 / ; caspase-2 / cell lines. Probing with antibody to Heat shock protein 70 (Hsp 70) was used as a loading control. (H) Wild-type IL-3–dependent cells (open bars) were cultured in the presence or absence of IL-3 and a mouse-specific Fas ligand blocking antibody. Closed bars show Jurkat cells with and without mouse Fas ligand and the Fas ligand blocking antibody. Viability was determined by Annexin V expression and PI exclusion by flow cytometry. The results for wild-type IL-3–dependent cells show the mean of two independent clones in three independent experiments and the results for Jurkat cells shows the mean of an experiment done in triplicate. Error bars are SEM.
Figure 2.
Figure 2.
After 24 h without IL-3, Apaf-1 / , caspase-9 /, and caspase-9 / ; caspase-2 / cells appear healthy, exclude PI but have released cytochrome c from mitochondria. (A) Light microscopy of cells cultured with or without IL-3 for the indicated genotype. Wild-type and caspase-2 / cells show similar changes, with marked cell shrinkage and loss of refractivity whereas Apaf-1 /, caspase-9 /, and caspase-9 / ; caspase-2 / cells appear healthy. (B) PI uptake determined by flow cytometry. Increasing fluorescence (FL-3 channel) indicates PI uptake by cells that have lost membrane integrity. The majority of Apaf-1 /, caspase-9 /, and caspase-9 / ; caspase-2 / cells exclude PI 24 h after withdrawal of IL-3. (C) Intracellular cytochrome c staining assessed by flow cytometry (FL-1 channel). Loss of cytochrome c from mitochondria is indicated by a shift of fluorescence to the left. Apaf-1 /, caspase-9 /, and caspase-9 / ; caspase-2 / cells lose cytochrome c like wild-type and caspase-2 −/2 cells, despite excluding PI. Bcl-2 overexpression (shown here in Bcl-2; caspase-9 / cells) prevents cytochrome c release. Multiple clones of cells of all genotypes were examined with and without IL-3, and typical results are shown.
Figure 3.
Figure 3.
Diminished caspase activity in IL-3–starved Apaf-1 / , caspase-9 /, and caspase-9 / ; caspase-2 / cells. Lysates from cells cultured in the presence or absence of IL-3 over a 3-d period were separated by SDS PAGE on 4–20% gradient gels and immunoblotted with antibodies to the indicated proteins. Activation of caspase-3 and caspase-7 is indicated by the loss of the full-length protein and, in the case of caspase-7, by the appearance of the processed p10 fragment. The cleavage of ICAD is indicated by the loss of the full-length protein. The ICAD cleavage fragment could not be observed. Levels of Hsp70 are shown as a loading control.
Figure 4.
Figure 4.
Apaf-1 / , caspase-9 /, and caspase-9 / ; caspase-2 / cells are committed to die after IL-3 withdrawal. Wild-type, Apaf-1 /, caspase-9 /, caspase-2 /, and caspase-9 / ; caspase-2 / cells were cultured in the presence (solid line) or absence (dashed line) of IL-3 for the indicated times. (A) Analysis of PI exclusion at each time point with and without growth factor. (B) Varying dilutions of cells were cultured in soft agar with abundant IL-3 after the indicated period of IL-3 deprivation, and the number of colonies formed was counted after 21 d. The y axis indicates the number of colony forming units per 1,000 cells originally plated. Values shown are the means of at least two independent clones for each genotype from four independent experiments. Error bars are ± SEM.
Figure 5.
Figure 5.
Expression of Bcl-2 provides protection against IL-3 withdrawal-induced apoptosis and promotes clonogenic survival. Cells of the indicated genotype containing either empty vector (pEF) or Bcl-2 expression construct were cultured in the absence of IL-3 for the indicated times. (A) Viability determined by PI exclusion using flow cytometry. (B) Varying dilutions of cells were cultured in soft agar with abundant IL-3 following the indicated period of IL-3 deprivation and the number of colonies formed counted after 21 d. The y axis represents the number of colony forming units per 1,000 cells originally plated. Western blots show the levels of Bcl-2 expression in the cell lines that were examined (five representative wild-type lines are shown). The value n represents the number of independent clones tested for each genotype. The values shown are the means ± SEM from three independent experiments.
Figure 6.
Figure 6.
Apaf-1 / and caspase-9 / ; caspase-2 / cells appear viable when treated with etoposide or doxorubicin, but are committed to die. Wild-type, Apaf-1 /, and caspase-9 / ; caspase-2 / cells were treated with the indicated doses of etoposide (A and B) or doxorubicin (C and D) for 24 h. Viability was determined by Annexin V staining and PI exclusion using flow cytometry (A and C), and clonogenic survival was determined by plating in soft agar and counting the number of colonies after 21 d (B and D). The viability curves show the mean ± SEM of two independent clones of each genotype in three independent experiments. The clonal assays show mean ± SEM of two independent clones of each genotype in two independent experiments.

References

    1. Cecconi, F., G. Alvarezbolado, B.I. Meyer, K.A. Roth, and P. Gruss. 1998. Apaf1 (CED-4 homolog) regulates programmed cell death in mammalian development. Cell. 94:727–737. - PubMed
    1. Chinnaiyan, A.M., K. Orourke, B.R. Lane, and V.M. Dixit. 1997. Interaction of CED-4 with CED-3 and CED-9 - a molecular framework for cell death. Science. 275:1122–1126. - PubMed
    1. Ekert, P.G., J. Silke, and D.L. Vaux. 1999. Inhibition of apoptosis and clonogenic survival of cells expressing crmA variants: optimal caspase substrates are not necessarily optimal inhibitors. EMBO J. 18:330–338. - PMC - PubMed
    1. Gottlieb, E., S.M. Armour, and C.B. Thompson. 2002. Mitochondrial respiratory control is lost during growth factor deprivation. Proc. Natl. Acad. Sci. USA. 99:12801–12806. - PMC - PubMed
    1. Hakem, R., A. Hakem, G.S. Duncan, J.T. Henderson, M. Woo, M.S. Soengas, A. Elia, J.L. Delapompa, D. Kagi, W. Khoo, et al. 1998. Differential requirement for caspase 9 in apoptotic pathways in vivo. Cell. 94:339–352. - PubMed

Publication types