. 2004 Jun 21;199(12):1659-69.
doi: 10.1084/jem.20040119.

The innate mononuclear phagocyte network depletes B lymphocytes through Fc receptor-dependent mechanisms during anti-CD20 antibody immunotherapy

Affiliations

The innate mononuclear phagocyte network depletes B lymphocytes through Fc receptor-dependent mechanisms during anti-CD20 antibody immunotherapy

Junji Uchida et al. J Exp Med. .

Abstract

Anti-CD20 antibody immunotherapy effectively treats non-Hodgkin's lymphoma and autoimmune disease. However, the cellular and molecular pathways for B cell depletion remain undefined because human mechanistic studies are limited. Proposed mechanisms include antibody-, effector cell-, and complement-dependent cytotoxicity, the disruption of CD20 signaling pathways, and the induction of apoptosis. To identify the mechanisms for B cell depletion in vivo, a new mouse model for anti-CD20 immunotherapy was developed using a panel of twelve mouse anti-mouse CD20 monoclonal antibodies representing all four immunoglobulin G isotypes. Anti-CD20 antibodies rapidly depleted the vast majority of circulating and tissue B cells in an isotype-restricted manner that was completely dependent on effector cell Fc receptor expression. B cell depletion used both FcgammaRI- and FcgammaRIII-dependent pathways, whereas B cells were not eliminated in FcR common gamma chain-deficient mice. Monocytes were the dominant effector cells for B cell depletion, with no demonstrable role for T or natural killer cells. Although most anti-CD20 antibodies activated complement in vitro, B cell depletion was completely effective in mice with genetic deficiencies in C3, C4, or C1q complement components. That the innate monocyte network depletes B cells through FcgammaR-dependent pathways during anti-CD20 immunotherapy has important clinical implications for anti-CD20 and other antibody-based therapies.


Figures

Figure 1.
Figure 1.
Reactivity of anti-CD20 mAbs with spleen B cells. (A) Fluorescence intensity of CD19+ cells stained with representative anti-CD20 (solid lines) or isotype-matched control (dashed line) mAbs (10 μg/ml). (B) Mean fluorescence intensity (MFI) of anti-CD20 mAb staining over a range of mAb concentrations. Arrows indicate mean intensities of mAb staining when used at 0.5 μg/ml. (C) Fluorescence intensity of CD19+ cells stained with anti-CD20 (solid lines) or isotype-matched control (dashed line) mAbs (0.5 μg/ml). In all cases, mAb staining was visualized using PE-conjugated isotype-specific secondary Abs with flow cytometry analysis. Results represent those obtained in three or more experiments.
Figure 2.
Figure 2.
B cell depletion in vivo. (A) Representative B cell depletion from blood (day 2) and spleen (day 7) after MB20-11 or isotype-matched control mAb treatment of WT or CD20−/− mice as determined by immunofluorescent staining with flow cytometry analysis. Numbers indicate the percentage of gated B220+ B cells. (B) Total numbers (± SEM) of blood (days 2 or 7, per ml) and spleen (day 7) B cells after treatment of two or more WT littermates with MB20 or isotype control mAbs. Significant differences between mean results for MB20 or isotype control mAb–treated mice are indicated. *, P < 0.05; **, P < 0.01. (C) Blood and spleen B cell numbers (± SEM) in WT littermates 7 d after treatment with MB20-11 mAb at different doses (two or more mice per data point). Significant differences between untreated (0) and mAb-treated mice are indicated. **, P < 0.01. (D) Blood and spleen B cell numbers (± SEM) in WT mice after MB20-11 (•) or isotype control (○) mAb treatment on day 0 (five or more mice per group). The value shown after time 0 represents data obtained at 1 h.
Figure 3.
Figure 3.
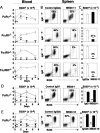
B cell depletion is FcγR dependent. (A) Blood B cell depletion after MB20-11 (•) or isotype control (○) mAb treatment of FcRγ−/−, FcγRI−/−, FcγRII−/−, and FcγRIII−/− mice on day 0. Values indicate mean circulating B cell numbers (± SEM, per ml) before (time 0) and 1 h or 2, 4, or 7 d after mAb treatment (five or more mice per time point). (B) Representative spleen B cell depletion 7 d after mAb treatment. Numbers indicate the percentage of B220+ lymphocytes within the indicated gates. (C) Mean spleen B cell numbers (± SEM) 7 d after MB20-11 (solid bars) or isotype control (open bars) mAb treatment (five or more mice per group). Numbers indicate the mean relative percentage of B220+ lymphocytes in anti-CD20 mAb–treated mice compared with control mAb–treated littermates. (D) B cell depletion after MB20-1 (•) or isotype control (○) mAb treatment of FcRγ−/− littermates on day 0 compared with MB20-1 (▪) or isotype control (□) mAb treatment of WT littermates on day 0. Representative spleen B cell depletion 7 d after MB20-1 or control mAb treatment of FcRγ−/− littermates. Numbers indicate the percentage of B220+ lymphocytes. Bar graphs represent mean spleen B cell numbers (± SEM) 7 d after MB20-1 or isotype control mAb treatment of FcRγ−/− (solid bars) or WT (open bars) mice (five or more mice per group). (E) Blood and spleen (day 7) B cell depletion after MB20-18 (•) or isotype control (○) mAb treatment of FcRγ−/− littermates on day 0 compared with MB20-18 (▪) or isotype control (□) mAb treatment of WT littermates on day 0. Histograms represent mean spleen B cell numbers (± SEM) 7 d after MB20-18 or isotype control mAb treatment of FcRγ−/− (solid bars) or WT (open bars) mice (five or more mice per group). (A–E) Significant differences between mean results for MB20 or isotype control mAb–treated mice are indicated. *, P < 0.05; **, P < 0.01.
Figure 4.
Figure 4.
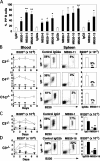
B cell depletion in vivo is C independent. (A) In vitro C-dependent cytotoxicity of MB20 mAbs for spleen B cells. Values represent the mean (± SEM) percentage of B220+ cells that were PI+ in three or more experiments. (B) B cell depletion after MB20-11 (•) or isotype control (○) mAb treatment of C3−/−, C4−/−, or C1q−/− mice on day 0. Blood values indicate mean circulating B cell numbers (± SEM, per ml) before (time 0) and 1 h or 2, 4, or 7 d after mAb treatment (five or more mice per time point). Representative spleen B cell frequencies and mean B cell numbers (± SEM) 7 d after MB20-11 (solid bars) and isotype control (open bars) mAb treatment (five or more mice per group). (C and D) Blood and spleen B cell depletion after MB20-1 or MB20-18 (•) or isotype control (○) mAb treatment of C3−/− mice on day 0 compared with MB20-1 or MB20-18 (▪) or isotype control (□) mAb treatment of WT mice on day 0. Representative spleen B cell depletion 7 d after MB20-1 or control mAb treatment of C3−/− littermates. Numbers indicate the percentage of B220+ lymphocytes within the indicated gates. Bar graphs represent mean spleen B cell numbers (± SEM) 7 d after MB20-1 or isotype control mAb treatment of C3−/− (solid bars) or WT (open bars) mice (five or more mice per group). (A–D) Significant differences between mean results for MB20 or isotype control mAb–treated mice are indicated. *, P < 0.05; **, P < 0.01.
Figure 5.
Figure 5.
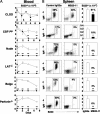
Monocytes mediate B cell depletion. WT mice were treated with clodronate (CLOD) as shown (arrows) to deplete macrophages, whereas other mice had genetic deficiencies in leukocyte subpopulations. (A) Blood B cell depletion after MB20-11 (•) or isotype control (○) mAb treatment on day 0. For clodronate-treated mice, blood B cell numbers were determined 1 h and 2, 4, and 7 d after mAb treatment, with the vertical dashed line indicating time 0 mAb treatment. For CSF1op mice, circulating B cell numbers were not quantified 1 h after mAb treatment because of the small size of these mice and the risk for mortality. B cell numbers at 1-h time points are shown for the other mouse genotypes. (B) Representative flow cytometry analysis and mean spleen B cell numbers (± SEM) 7 d after MB20-11 (solid bars) or isotype control (open bars) mAb treatment (five or more mice per group). Significant differences between mean results from isotype control or MB20 mAb–treated cells are indicated. *, P < 0.05; **, P < 0.01.

References

    1. Tedder, T.F., and P. Engel. 1994. CD20: a regulator of cell-cycle progression of B lymphocytes. Immunol. Today. 15:450–454. - PubMed
    1. Press, O.W., J.P. Leonard, B. Coiffier, R. Levy, and J. Timmerman. 2001. Immunotherapy of non-Hodgkin's lymphomas. Hematology. (Am. Soc. Hematol. Educ. Program). 2001:221–240. - PubMed
    1. Kaminski, M.S., K.R. Zasadny, I.R. Francis, A.W. Milik, C.W. Ross, S.D. Moon, S.M. Crawford, J.M. Burgess, N.A. Petry, G.M. Butchko, et al. 1993. Radioimmunotherapy of B-cell lymphoma with [131I]anti-B1 (anti-CD20) antibody. N. Engl. J. Med. 329:459–465. - PubMed
    1. Weiner, L.M. 1999. Monoclonal antibody therapy of cancer. Semin. Oncol. 26:43–51. - PubMed
    1. Onrust, S.V., H.M. Lamb, and J.A. Balfour. 1999. Rituximab. Drugs. 58:79–88. - PubMed

Publication types