. 2004 Jun 29;101(26):9660-5.
doi: 10.1073/pnas.0300552101. Epub 2004 Jun 21.

Simultaneous mapping of filamentous actin flow and turnover in migrating cells by quantitative fluorescent speckle microscopy

Affiliations

Simultaneous mapping of filamentous actin flow and turnover in migrating cells by quantitative fluorescent speckle microscopy

Pascal Vallotton et al. Proc Natl Acad Sci U S A. .

Abstract

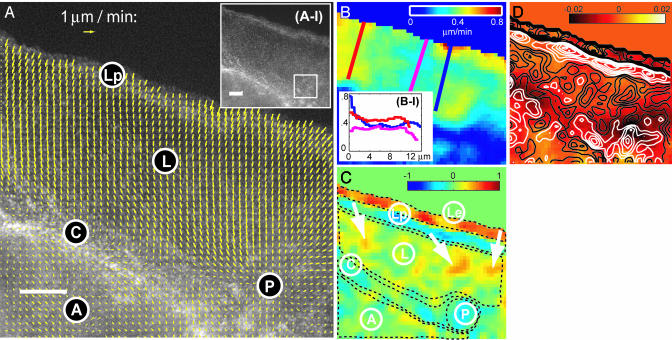
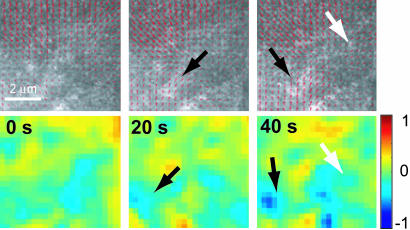
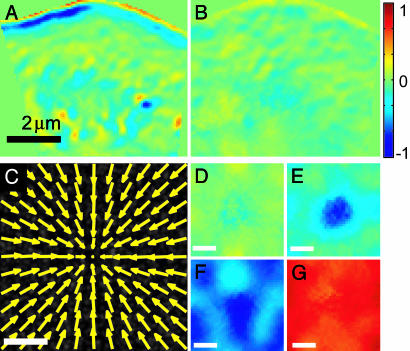
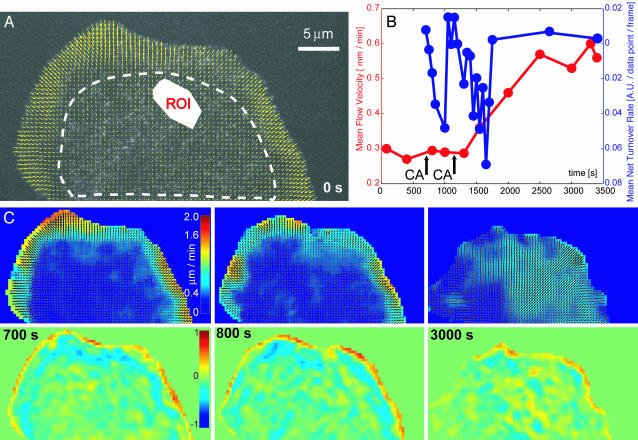
We report advances in quantitative fluorescent speckle microscopy to generate simultaneous maps of cytoskeleton flow and rates of net assembly and disassembly in living cells. We apply this tool to analyze the filamentous actin (F-actin) dynamics at the front of migrating cells. F-actin turnover and flow are both known to be factors of cell locomotion. However, how they are orchestrated to produce directed cell movements is poorly understood. Our approach to data analysis allows us to examine their interdependence. Our maps confirm the previously described organization of flow into a lamellipodium and a lamellum, both exhibiting retrograde flow; and a convergence zone, where lamellum retrograde flow meets with slow anterograde flow of cortical F-actin at the ventral side of the cell body. The turnover maps show the well known actin polymerization at the leading edge, but also indicate that approximately 90% of the polymer disassembles at the lamellipodium-lamellum junction. Strong depolymerization is also found in the convergence zone, where meshwork contraction is prominent. To determine whether contraction and depolymerization are coupled events, we have treated cells with calyculin A, which is known to promote myosin activity. Stimulated contraction was accompanied by accelerated retrograde flow and increased depolymerization throughout the lamellum, whereas disassembly at the lamellipodium-lamellum junction remained unaffected. There appear to be two distinct depolymerization mechanisms, of which one depends directly on meshwork contraction.


Figures

Fig. 1.
Fig. 1.
Analysis of F-actin dynamics at the protruding front of a migrating newt lung epithelial cell. (A) Vector map of F-actin flow as obtained by single-particle tracking of speckles. The map is interpolated on a grid of 670 nm side length by using data from five consecutive frames (50 s). (Scale bar, 5 μm.) (Inset) Raw FSM image data. The box indicates the position where meshwork dynamics is analyzed in detail in Fig. 2. (B) Map of the flow speed. (Inset) Profiles at three different locations. (C) Map of net meshwork turnover normalized to a scale of -1... 1. Negative values indicate disassembly and positive values indicate assembly. Dashed lines depict zones analyzed numerically in Table 1. See text for further explanations of labels and arrows. (D) Contour map (white, disassembly; black, assembly) of net turnover rates overlaid to a color representation of div(v(x, t)).
Fig. 2.
Fig. 2.
Coupling of F-actin transport and turnover over 40 s in a subregion of the meshwork indicated in Fig. 1A. See text for a discussion of the dynamics.
Fig. 3.
Fig. 3.
Validation of the algorithm used to reconstruct maps of F-actin turnover from FSM time-lapse series. Turnover before (A) and after (B) perfusion of the cell with jasp, a cytotoxin known to stabilize actin filaments and thus decrease the rate of disassembly. Reduced depolymerization slows the assembly process, suggesting that the recycling of dissociated monomers is in these cells rate limiting for meshwork polymerization. (C) Centripetal flow reconstructed from the synthetic FSM movies (Movies 4–7, which are published as supporting information on the PNAS web site). (D–G) Maps of turnover reconstructed under different kinetic conditions. See text and supporting information for further explanation.
Fig. 4.
Fig. 4.
Analysis of F-actin dynamics at the front of a cell treated with CA. (A) Flow map at the first time point (0 s) before CA perfusion. (B) Evolution of flow speed (red) and net turnover rates (blue) over 3,000 s. Time points of twofold drug application are indicated by arrows. The regions of interest used for the calculation of averaged flow speed and net turnover rates are indicated in A by a ROI polygon and a dashed, white line, respectively. (C) Selected frames of the analyzed time series. Animated maps are provided as Movies 8–10, which are published as supporting information on the PNAS web site. The image in Lower Left was acquired right before the first application of CA; the image in Lower Center was acquired 100 s afterward. The image in Lower Right is the last in the movie and indicates the elimination of flow and turnover gradients at the lamellipodium–lamellum junction.

Similar articles

Cited by

References

    1. Mitchison, T. J. & Cramer, L. P. (1996) Cell 84, 371-379. - PubMed
    1. Borisy, G. G. & Svitkina, T. M. (2000) Curr. Opin. Cell Biol. 12, 104-112. - PubMed
    1. Small, J. V., Stradal, T., Vignal, E. & Rottner, K. (2002) Trends Cell Biol. 12, 112-120. - PubMed
    1. Cramer, L. P. (1999) Curr. Biol. 9, 1095-1105. - PubMed
    1. Cramer, L. P. (1997) Front Biosci. 2, 260-270. - PubMed

Publication types

MeSH terms

LinkOut - more resources