. 2004 Jul 6;101(27):10143-8.
doi: 10.1073/pnas.0401422101. Epub 2004 Jun 21.

Effects of cigarette smoke on the human airway epithelial cell transcriptome

Affiliations

Effects of cigarette smoke on the human airway epithelial cell transcriptome

Avrum Spira et al. Proc Natl Acad Sci U S A. .

Abstract

Cigarette smoke is the major cause of lung cancer, the leading cause of cancer death, and of chronic obstructive pulmonary disease, the fourth leading cause of death in the United States. Using high-density gene expression arrays, we describe genes that are normally expressed in a subset of human airway epithelial cells obtained at bronchoscopy (the airway transcriptome), define how cigarette smoking alters the transcriptome, and detail the effects of variables, such as cumulative exposure, age, sex, and race, on cigarette smoke-induced changes in gene expression. We also determine which changes in gene expression are and are not reversible when smoking is discontinued. The persistent altered expression of a subset of genes in former smokers may explain the risk these individuals have for developing lung cancer long after they have discontinued smoking. The use of gene expression profiling to explore the normal biology of a specific subset of cells within a complex organ across a broad spectrum of healthy individuals and to define the reversible and irreversible genetic effects of cigarette smoke on human airway epithelial cells has not been previously reported.


Figures
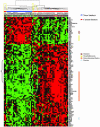
Fig. 1.
Fig. 1.
Clustering of current- and never-smoker samples. Hierarchical clustering of current (n = 34) and never (n = 23) smokers according to the expression of the 97 genes differentially expressed between current and never smokers. Although current and never smokers separate into two groups, three current smokers appear to cluster with never smokers (yellow rectangle). Expression of several redox-related and xenobiotic genes in these subjects was not increased (brackets) and therefore resembled that of never smokers despite substantial smoke exposure. Also, a subset of current smokers (yellow circle) did not up-regulate expression of a number of predominantly redox/xenobiotic genes (white circle) to the same degree as other smokers. In addition, a never smoker, 167N (blue box), is an outlier among never smokers and expresses a subset of genes at the level of current smokers. HUGO gene ID listed for all 97 genes. The functional classification of select genes is shown. Red, high level of expression; green, low level of expression; black, mean level of expression.
Fig. 2.
Fig. 2.
Multidimensional scaling plot of current-, never-, and former-smoker samples. Multidimensional scaling plot of current (red boxes), never (green boxes), and former smokers (blue boxes) in 97 dimensional space according to the expression of the 97 genes differentially expressed between current and never smokers. Current and never smokers separate into their two classes according to the expression of these genes (A). When former smokers are plotted according to the expression of these genes (B), a majority of former smokers appear to group more closely to never smokers. However, a number of former smokers group more closely to current smokers (black circle). The only clinical variable that differed between the two groups of former smokers was length of smoking cessation (P < 0.05), with formers smokers who quit within 2 years clustering with current smokers. The multidimensional scaling plots are reduced-dimension representations of the data, and the axes on the figure have no units.
Fig. 3.
Fig. 3.
Genes irreversibly altered by cigarette smoke. Hierarchical clustering plot of 15 of the 97 probe sets from Fig. 1 that remain differentially expressed between former vs. never smokers (P < 0.0001) as long as 30 years after cessation of smoking. Samples are grouped according to smoking status and length of smoking cessation (samples are not being clustered and, thus, no dendogram occurs on the sample axis). Patient ID, status (C, F, or N), and length of time (years) because smoking cessation are shown for each sample. Current, current smokers; former, former smokers; never, never smokers. HUGO gene ID is listed for all 15 genes. Two genes (HLF and MT1X) appear twice in the analysis (i.e., two different probe sets corresponding to the same gene). Red, high level of expression; green, low level of expression; black, mean level of expression.

References

    1. Proctor, R. N. (2001) Nat. Rev. Cancer 1, 82-86. - PubMed
    1. Greenlee, R. T., Hill-Harmon, M. B., Murray, T. & Thun, M. (2001) CA Cancer J. Clin. 51, 15-36. - PubMed
    1. Hecht, S. S. (2003) Nat. Rev. Cancer 3, 733-744. - PubMed
    1. Anderson, R. & Smith, B. (2003) Natl. Vital Stat. Rep. 52, 7-11.
    1. Shields, P. G. (1999) Ann. Oncol. 10, Suppl. 5, S7-S11. - PubMed

Publication types